. 2012:6:155-68.
doi: 10.4137/BBI.S9426. Epub 2012 Jul 2.

DNA structural properties in the classification of genomic transcription regulation elements

Affiliations

DNA structural properties in the classification of genomic transcription regulation elements

Pieter Meysman et al. Bioinform Biol Insights. 2012.

Abstract

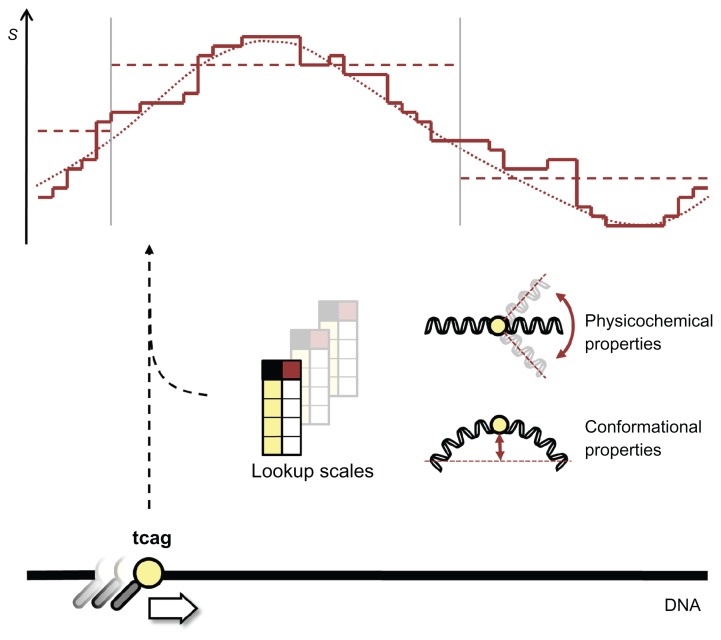
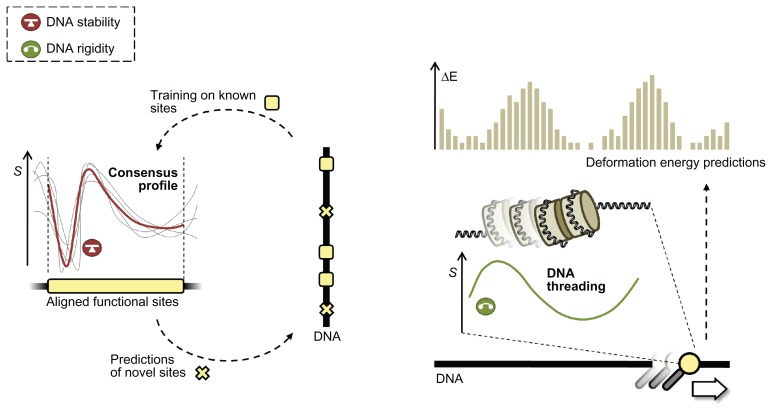
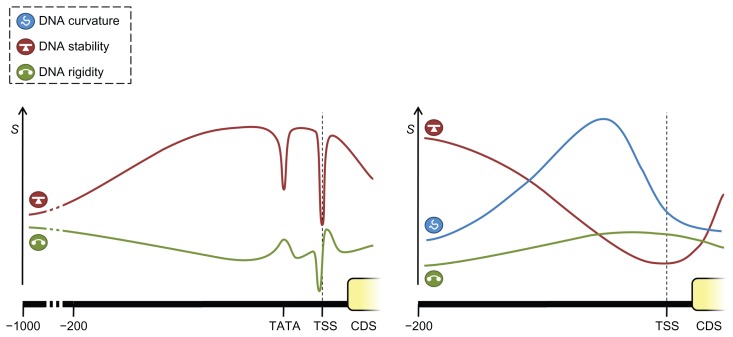
It has been long known that DNA molecules encode information at various levels. The most basic level comprises the base sequence itself and is primarily important for the encoding of proteins and direct base recognition by DNA-binding proteins. A more elusive level consists of the local structural properties of the DNA molecule wherein the DNA sequence only plays an indirect supportive role. These properties are nevertheless an important factor in a large number of biomolecular processes and can be considered as informative signals for the presence of a variety of genomic features. Several recent studies have unequivocally shown the benefit of relying on such DNA properties for modeling and predicting genomic features as diverse as transcription start sites, transcription factor binding sites, or nucleosome occupancy. This review is meant to provide an overview of the key aspects of these DNA conformational and physicochemical properties. To illustrate their potential added value compared to relying solely on the nucleotide sequence in genomics studies, we discuss their application in research on transcription regulation mechanisms as representative cases.

Keywords: DNA structure; functional genomics; structural scales; transcription.


Figures

Figure 1
Figure 1
Modeling structural properties of the DNA. Notes: Along the length of the DNA all oligonucleotides of a certain order (usually di- or trinucleotides) are looked up in a table (called a structural scale) which contains corresponding values measuring a certain structural property. These structural scales can represent conformational or physicochemical structural properties, and when viewed along the length of the DNA form a structural profile. Due to the discrete nature of the scale values, a structural profile usually has a staircase-like appearance (full line; the S axis represents the structural property values obtained from the lookup scales). Often these profiles are further smoothed (dotted line), or one might take the average value over a stretch of DNA of a given length (horizontal dashed lines) before they are put to use.
Figure 2
Figure 2
Predicting DNA binding from DNA structural properties. Notes: In the case of the consensus approach (left hand panel), all known binding sites are used to generate a consensus profile (red line, representing the structural property stability in this example), which in turn can be used to predict novel binding sites. The consensus profile is an average of structural profiles of aligned known binding sites (grey lines). In DNA threading (right hand panel), a sliding window moves along the DNA calculating the energy required (ΔE axis) for the given stretch of DNA to adapt the required conformation based on structural profiles, in this figure represented by the deformability (green line).
Figure 3
Figure 3
Conceptual representation of structural features of eukaryotic and prokaryotic promoters. Notes: Eukaryotic proximal promoters (left hand panel) are generally characterized by an increased stability (red line; the S axis represents the structural property values) and a decreasing rigidity (green line) compared to surrounding regions (although eukaryotic promoters on average still have a higher rigidity than the rest of the genome), with strong peaks or valleys at functional sites such as the TSS or TATA box. In contrast, prokaryotic promoters on average have a decreased stability (red line) and increased rigidity (green line) and have been observed to show a broad curvature peak (blue line) upstream of the TSS.

References

    1. Bareket-Samish A, Cohen I, Haran TE. Direct versus indirect readout in the interaction of the trp repressor with non-canonical binding sites. Journal of Molecular Biology. 1998;277(5):1071–80. - PubMed
    1. Florquin K, Saeys Y, Degroeve S, Rouzé P, Van de Peer Y. Large-scale structural analysis of the core promoter in mammalian and plant genomes. Nucleic Acids Research. 2005;33(13):4255–64. - PMC - PubMed
    1. Michael Gromiha M, Siebers JG, Selvaraj S, Kono H, Sarai A. Intermolecular and intramolecular readout mechanisms in protein-DNA recognition. Journal of Molecular Biology. 2004;337(2):285–94. - PubMed
    1. Lipps HJ, Rhodes D. G-quadruplex structures: in vivo evidence and function. Trends in Cell Biology. 2009;19(8):414–22. - PubMed
    1. Johnson JE, Smith JS, Kozak ML, Johnson FB. In vivo veritas: using yeast to probe the biological functions of G-quadruplexes. Biochimie. 2008;90(8):1250–63. - PMC - PubMed

LinkOut - more resources