

The gene expression landscape of breast cancer is shaped by tumor protein p53 status and epithelial-mesenchymal transition
- PMID: 22839103
- PMCID: PMC3680939
- DOI: 10.1186/bcr3236
The gene expression landscape of breast cancer is shaped by tumor protein p53 status and epithelial-mesenchymal transition
Abstract
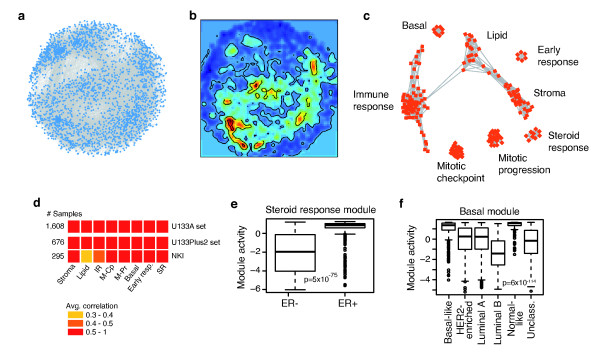
Introduction: Gene expression data derived from clinical cancer specimens provide an opportunity to characterize cancer-specific transcriptional programs. Here, we present an analysis delineating a correlation-based gene expression landscape of breast cancer that identifies modules with strong associations to breast cancer-specific and general tumor biology.
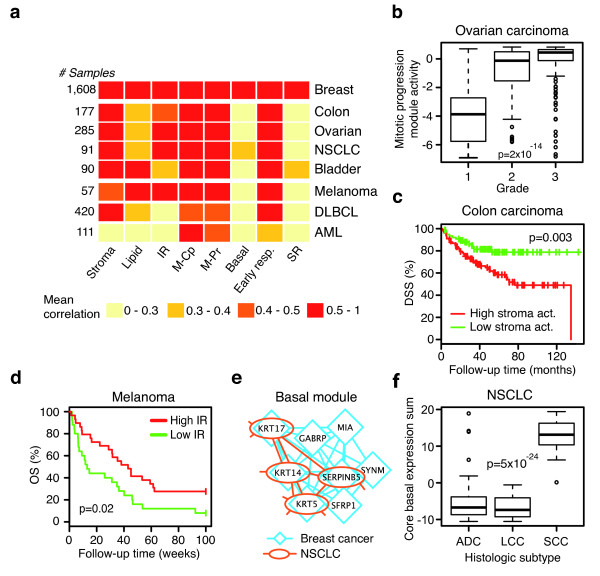
Methods: Modules of highly connected genes were extracted from a gene co-expression network that was constructed based on Pearson correlation, and module activities were then calculated using a pathway activity score. Functional annotations of modules were experimentally validated with an siRNA cell spot microarray system using the KPL-4 breast cancer cell line, and by using gene expression data from functional studies. Modules were derived using gene expression data representing 1,608 breast cancer samples and validated in data sets representing 971 independent breast cancer samples as well as 1,231 samples from other cancer forms.
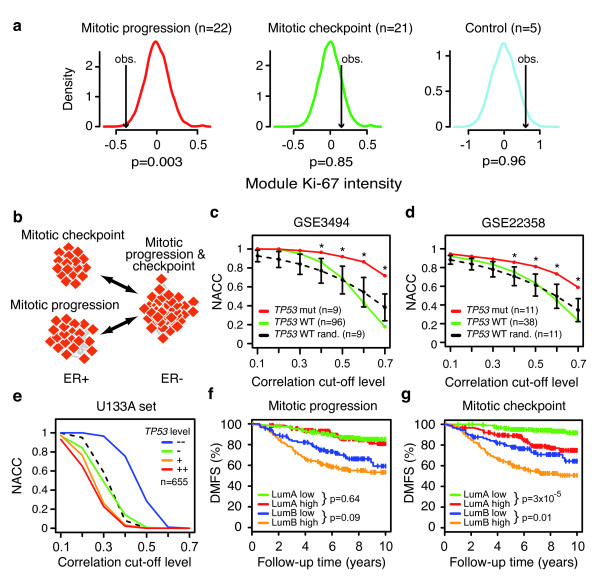
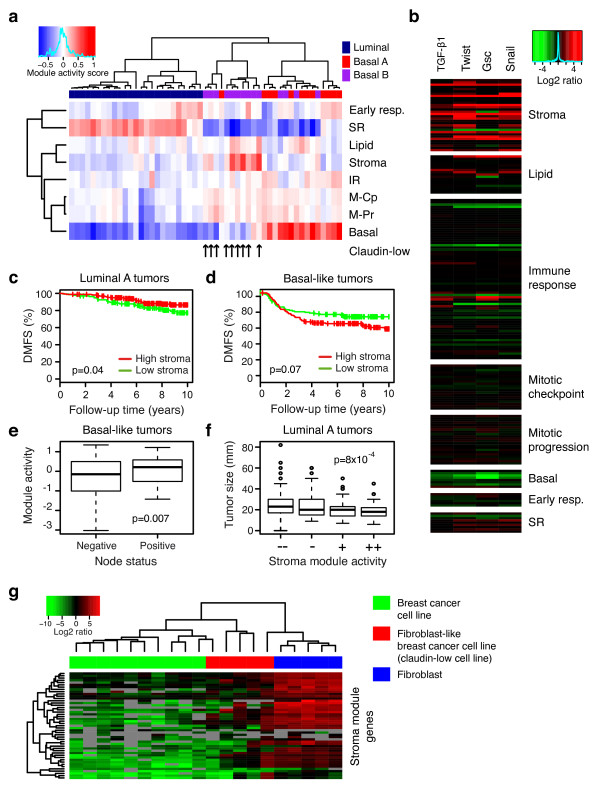
Results: The initial co-expression network analysis resulted in the characterization of eight tightly regulated gene modules. Cell cycle genes were divided into two transcriptional programs, and experimental validation using an siRNA screen showed different functional roles for these programs during proliferation. The division of the two programs was found to act as a marker for tumor protein p53 (TP53) gene status in luminal breast cancer, with the two programs being separated only in luminal tumors with functional p53 (encoded by TP53). Moreover, a module containing fibroblast and stroma-related genes was highly expressed in fibroblasts, but was also up-regulated by overexpression of epithelial-mesenchymal transition factors such as transforming growth factor beta 1 (TGF-beta1) and Snail in immortalized human mammary epithelial cells. Strikingly, the stroma transcriptional program related to less malignant tumors for luminal disease and aggressive lymph node positive disease among basal-like tumors.
Conclusions: We have derived a robust gene expression landscape of breast cancer that reflects known subtypes as well as heterogeneity within these subtypes. By applying the modules to TP53-mutated samples we shed light on the biological consequences of non-functional p53 in otherwise low-proliferating luminal breast cancer. Furthermore, as in the case of the stroma module, we show that the biological and clinical interpretation of a set of co-regulated genes is subtype-dependent.
Figures
Similar articles
-
A signature of epithelial-mesenchymal plasticity and stromal activation in primary tumor modulates late recurrence in breast cancer independent of disease subtype.Breast Cancer Res. 2014 Jul 25;16(4):407. doi: 10.1186/s13058-014-0407-9. Breast Cancer Res. 2014. PMID: 25060555 Free PMC article.
-
The dual role of FOXF2 in regulation of DNA replication and the epithelial-mesenchymal transition in breast cancer progression.Cell Signal. 2016 Oct;28(10):1502-19. doi: 10.1016/j.cellsig.2016.06.021. Epub 2016 Jul 1. Cell Signal. 2016. PMID: 27377963 Free PMC article.
-
Abrogation of p53 function leads to metastatic transcriptome networks that typify tumor progression in human breast cancer xenografts.Int J Oncol. 2010 Nov;37(5):1167-76. doi: 10.3892/ijo_00000768. Int J Oncol. 2010. PMID: 20878064 Free PMC article.
-
p53 in breast cancer subtypes and new insights into response to chemotherapy.Breast. 2013 Aug;22 Suppl 2:S27-9. doi: 10.1016/j.breast.2013.07.005. Breast. 2013. PMID: 24074787 Review.
-
Decoding the link between WWOX and p53 in aggressive breast cancer.Cell Cycle. 2019 Jun;18(11):1177-1186. doi: 10.1080/15384101.2019.1616998. Epub 2019 May 16. Cell Cycle. 2019. PMID: 31075076 Free PMC article. Review.
Cited by
-
Grading breast cancer tissues using molecular portraits.Mol Cell Proteomics. 2013 Dec;12(12):3612-23. doi: 10.1074/mcp.M113.030379. Epub 2013 Aug 27. Mol Cell Proteomics. 2013. PMID: 23982162 Free PMC article.
-
Impact of prolactin treatment on enhancing the cellular responses of MCF7 breast cancer cells to tamoxifen treatment.Discov Oncol. 2024 Dec 18;15(1):797. doi: 10.1007/s12672-024-01701-x. Discov Oncol. 2024. PMID: 39692941 Free PMC article.
-
Distinct luminal-type mammary carcinomas arise from orthotopic Trp53-null mammary transplantation of juvenile versus adult mice.Cancer Res. 2014 Dec 1;74(23):7149-58. doi: 10.1158/0008-5472.CAN-14-1440. Epub 2014 Oct 3. Cancer Res. 2014. PMID: 25281718 Free PMC article.
-
A matrisome RNA signature from early-pregnancy mouse mammary fibroblasts predicts distant metastasis-free breast cancer survival in humans.Breast Cancer Res. 2021 Sep 26;23(1):90. doi: 10.1186/s13058-021-01470-3. Breast Cancer Res. 2021. PMID: 34565423 Free PMC article.
-
Targeting IGF-IR improves neoadjuvant chemotherapy efficacy in breast cancers with low IGFBP7 expression.NPJ Precis Oncol. 2024 Oct 3;8(1):212. doi: 10.1038/s41698-024-00712-9. NPJ Precis Oncol. 2024. PMID: 39362991 Free PMC article.
References
-
- Bogaerts J, Cardoso F, Buyse M, Braga S, Loi S, Harrison JA, Bines J, Mook S, Decker N, Ravdin P, Therasse P, Rutgers E, van 't Veer LJ, Piccart M. Gene signature evaluation as a prognostic tool: challenges in the design of the MINDACT trial. Nat Clin Pract Oncol. 2006;14:540–551. - PubMed
-
- Ashburner M, Ball CA, Blake JA, Botstein D, Butler H, Cherry JM, Davis AP, Dolinski K, Dwight SS, Eppig JT, Harris MA, Hill DP, Issel-Tarver L, Kasarskis A, Lewis S, Matese JC, Richardson JE, Ringwald M, Rubin GM, Sherlock G. Gene ontology: tool for the unification of biology. The Gene Ontology Consortium. Nat Genet. 2000;14:25–29. doi: 10.1038/75556. - DOI - PMC - PubMed
-
- Subramanian A, Tamayo P, Mootha VK, Mukherjee S, Ebert BL, Gillette MA, Paulovich A, Pomeroy SL, Golub TR, Lander ES, Mesirov JP. Gene set enrichment analysis: a knowledge-based approach for interpreting genome-wide expression profiles. Proc Natl Acad Sci USA. 2005;14:15545–15550. doi: 10.1073/pnas.0506580102. - DOI - PMC - PubMed
-
- Sorlie T, Perou CM, Tibshirani R, Aas T, Geisler S, Johnsen H, Hastie T, Eisen MB, van de Rijn M, Jeffrey SS, Thorsen T, Quist H, Matese JC, Brown PO, Botstein D, Eystein Lonning P, Borresen-Dale AL. Gene expression patterns of breast carcinomas distinguish tumor subclasses with clinical implications. Proc Natl Acad Sci USA. 2001;14:10869–10874. doi: 10.1073/pnas.191367098. - DOI - PMC - PubMed
Publication types
MeSH terms
Substances
LinkOut - more resources
Full Text Sources
Medical
Research Materials
Miscellaneous
