. 2012 Jul 28:13:184.
doi: 10.1186/1471-2105-13-184.

Computational modeling of the bHLH domain of the transcription factor TWIST1 and R118C, S144R and K145E mutants

Affiliations

Computational modeling of the bHLH domain of the transcription factor TWIST1 and R118C, S144R and K145E mutants

Amanda M Maia et al. BMC Bioinformatics. .

Abstract

Background: Human TWIST1 is a highly conserved member of the regulatory basic helix-loop-helix (bHLH) transcription factors. TWIST1 forms homo- or heterodimers with E-box proteins, such as E2A (isoforms E12 and E47), MYOD and HAND2. Haploinsufficiency germ-line mutations of the twist1 gene in humans are the main cause of Saethre-Chotzen syndrome (SCS), which is characterized by limb abnormalities and premature fusion of cranial sutures. Because of the importance of TWIST1 in the regulation of embryonic development and its relationship with SCS, along with the lack of an experimentally solved 3D structure, we performed comparative modeling for the TWIST1 bHLH region arranged into wild-type homodimers and heterodimers with E47. In addition, three mutations that promote DNA binding failure (R118C, S144R and K145E) were studied on the TWIST1 monomer. We also explored the behavior of the mutant forms in aqueous solution using molecular dynamics (MD) simulations, focusing on the structural changes of the wild-type versus mutant dimers.

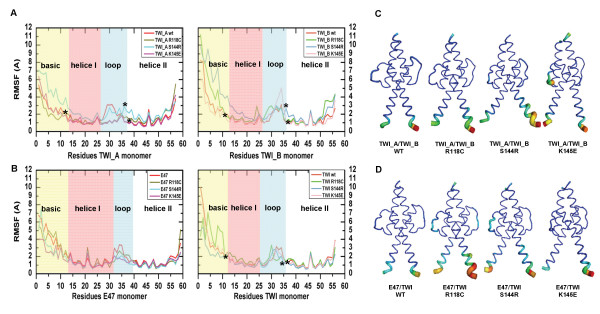
Results: The solvent-accessible surface area of the homodimers was smaller on wild-type dimers, which indicates that the cleft between the monomers remained more open on the mutant homodimers. RMSD and RMSF analyses indicated that mutated dimers presented values that were higher than those for the wild-type dimers. For a more careful investigation, the monomer was subdivided into four regions: basic, helix I, loop and helix II. The basic domain presented a higher flexibility in all of the parameters that were analyzed, and the mutant dimer basic domains presented values that were higher than the wild-type dimers. The essential dynamic analysis also indicated a higher collective motion for the basic domain.

Conclusions: Our results suggest the mutations studied turned the dimers into more unstable structures with a wider cleft, which may be a reason for the loss of DNA binding capacity observed for in vitro circumstances.


Figures

Figure 1
Figure 1
Analysis of protein globularity. (A) The x axis represents the sequence residues and the sum of disorder propensities are on the y axis. The yellow bars (upper left) correspond to residues with low structural complexity, the green bars correspond to the globular domain, and the blue bars represent the disordered residues. (B) The protein sequence is colored according to the Russel/Linding disorder definition, where the red residues have disorder propensity.
Figure 2
Figure 2
Schematic representation of the human TWIST1 protein. (A) Multiple sequence alignments for the bHLH domain of human TWIST1 and sequences belonging to different species. Conserved residues among species are highlighted in blue blocks. The modeled mutation positions R118C, S144R and K145E are indicated by red arrows. (B) Alignment between the TWIST1_bHLH sequence and the sequences that correspond to both chains of 2QL2 dimers (C – E47 and D – NeuroD1). All of the alignments were generated by ClustalW2 with default parameters and were plotted with the BioEdit program. The symbol ”*” indicates identical amino acids between sequences and “:” indicates conserved substitutions; “.” indicates semi-conserved substitutions. The yellow blocks highlight conserved residues. Hs – Homo sapiens; Mm – Mus musculus; Xl – Xenopus laevis; Dm – Drosophila melanogaster.
Figure 3
Figure 3
Front and side view of the TWIST1 dimers. (A) The cartoon representation of the plausible structure for the TWIST1 dimer in complex with DNA. (B) The cartoon representation of modeled dimers TWI_A/TWI_B (frontal and side views) and (C) the modeled dimer E47/TWI (E47 - pink frontal and side view). (D), (E) and (F) present the modeled homodimer TWI_A/TWI_B harboring the R118C, S144R and K145E mutations, respectively. The side chains of all three mutations are depicted in the side boxes.
Figure 4
Figure 4
Structural stability assessment during the MD simulations. The first row presents the interaction potential energy assessed for all dimers using Coulomb and Lennard-Jones terms. The images in the left column depict the wt and mutant homodimers (TWI_A/TWI_B), and the images in the right column depict the wt and mutant heterodimers (E47/TWI). The second row represents the variation of the solvent accessible surface area (SASA) for the dimers and was calculated by subtracting the sum of the SASA of the individual monomers from the SASA of their respective dimer [ΔSASA = TWI_A/TWI_B SASA – (TWI_A SASA + TWI_B SASA)]. The ΔSASA for the homodimers is presented in the left column and the heterodimer value is presented in the right column. The RMSD analysis (third and fourth row) for all of the monomers was calculated as a function of the backbone structure and separately according to the monomers. The third row images represent homodimer monomers (in the left column TWI_A and in the right column TWI_B wt and mutant monomers), and on the fourth row the heterodimer monomers are depicted (E47 monomers in the left column and TWI wt and mutant monomers in the right column). Å – angstrom (10-10 m); kJ – kilojoule (103joules); mol - 6,02 · 1023 particles; ns – nanoseconds (10-9 s).
Figure 5
Figure 5
Comparison of the atomic fluctuations per residue for the last 30 ns of the simulation. The RMSF values for each monomer of the homodimer and heterodimer are displayed in (A) and (B), respectively. Asterisks (*) indicate the mutated residues of the TWIST1 monomer. The b-factors represented in cartoon form for the homo- and heterodimers (the wt and mutants) are displayed in (C) and (D), respectively. The most fluctuating residues are colored in red (terminal residues), and the remainder of the dimer is in light blue (the most stable), in accordance with the observed fluctuations observed. Å – angstrom (10-10 m);ns – nanoseconds (10-9 s).
Figure 6
Figure 6
RMSD and Rg of the basic region of each monomer for 50 ns of simulation time. (A) The RMSD and (B) the Rg behavior of all dimers. The minimized structures (t = 0 ns) were taken as a reference. The upper images represent the homodimers (TWI_A and TWI_B) and the bottom images correspond to the heterodimers (E47 and TWI). Å – angstrom (10-10 m);ns – nanoseconds (10-9 s).
Figure 7
Figure 7
Collective motion analysis. (A) and (B) represent the percentage of cumulative eigenvalues as a function of eigenvector indices for the homodimers and heterodimers, respectively. (C) and (D) represent the porcupine plot of the first eigenvector of the homodimer and heterodimer, respectively. The basic domain is colored in orange for the TWIST1 monomers and in yellow for the E47 monomer. The cones point in the direction of indication mode of atomic movement, and the amplitude of the motion is represented by the length of the cone.

References

    1. Anderson DJ. et al.Cell lineage determination and the control of neuronal identity in the neural crest. Cold Spring Harb Symp Quant Biol. 1997;62:493–504. - PubMed
    1. Lister JA, Baron MH. Induction of basic helix-loop-helix protein-containing complexes during erythroid differentiation. Gene Expr. 1998;7(1):25–38. - PMC - PubMed
    1. Murray SS. et al.Expression of helix-loop-helix regulatory genes during differentiation of mouse osteoblastic cells. J Bone Miner Res. 1992;7(10):1131–8. - PubMed
    1. Murre C, McCaw PS, Baltimore D. A new DNA binding and dimerization motif in immunoglobulin enhancer binding, daughterless, MyoD, and myc proteins. Cell. 1989;56(5):777–83. doi: 10.1016/0092-8674(89)90682-X. - DOI - PubMed
    1. Firulli BA. et al.Altered Twist1 and Hand2 dimerization is associated with Saethre-Chotzen syndrome and limb abnormalities. Nat Genet. 2005;37(4):373–81. doi: 10.1038/ng1525. - DOI - PMC - PubMed

Publication types

MeSH terms

Substances

LinkOut - more resources