. 2012 Jul 29:13:347.
doi: 10.1186/1471-2164-13-347.

Patterns and architecture of genomic islands in marine bacteria

Affiliations

Patterns and architecture of genomic islands in marine bacteria

Beatriz Fernández-Gómez et al. BMC Genomics. .

Abstract

Background: Genomic Islands (GIs) have key roles since they modulate the structure and size of bacterial genomes displaying a diverse set of laterally transferred genes. Despite their importance, GIs in marine bacterial genomes have not been explored systematically to uncover possible trends and to analyze their putative ecological significance.

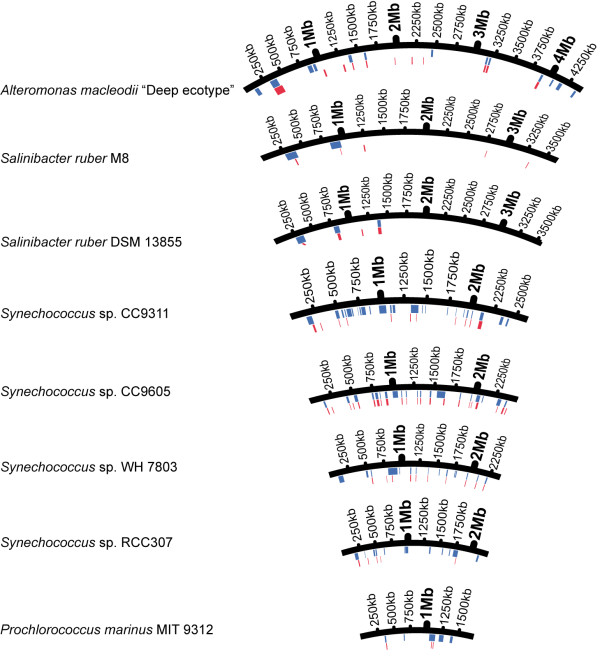
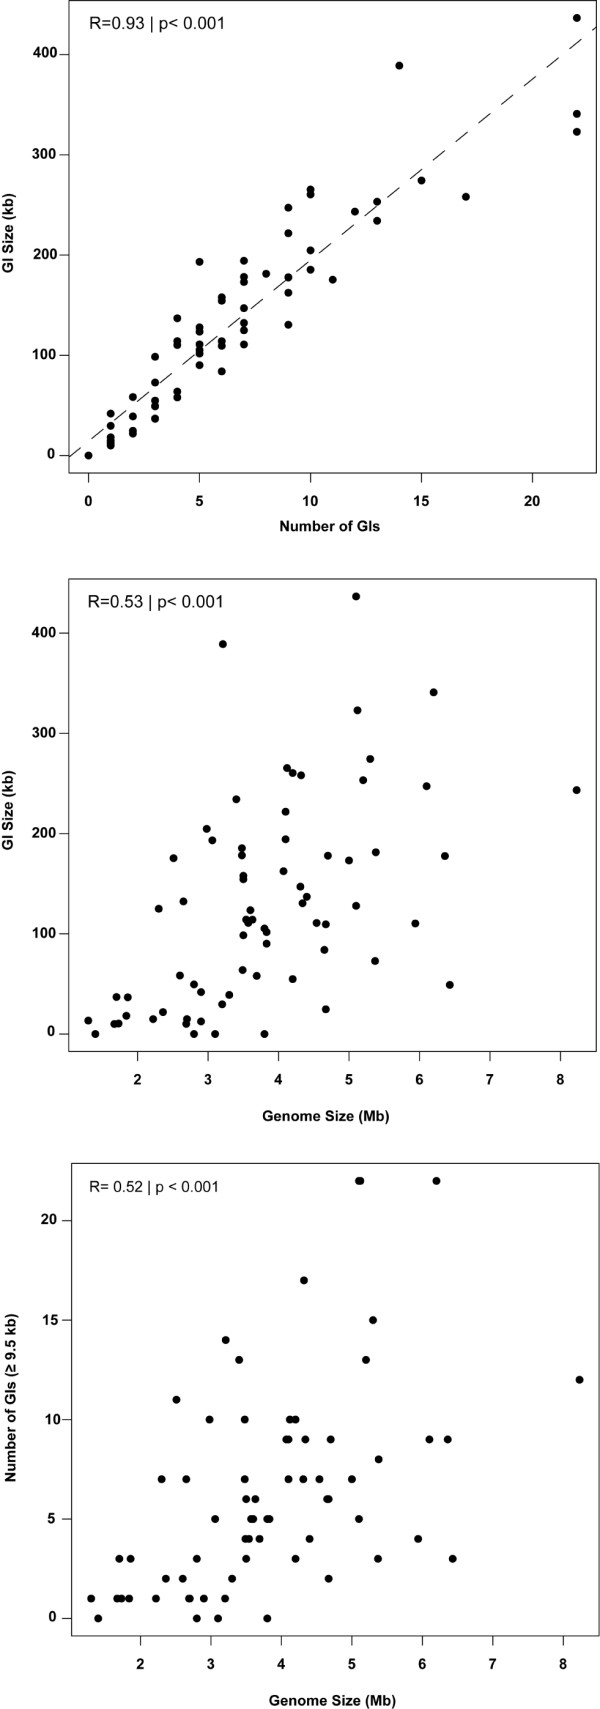
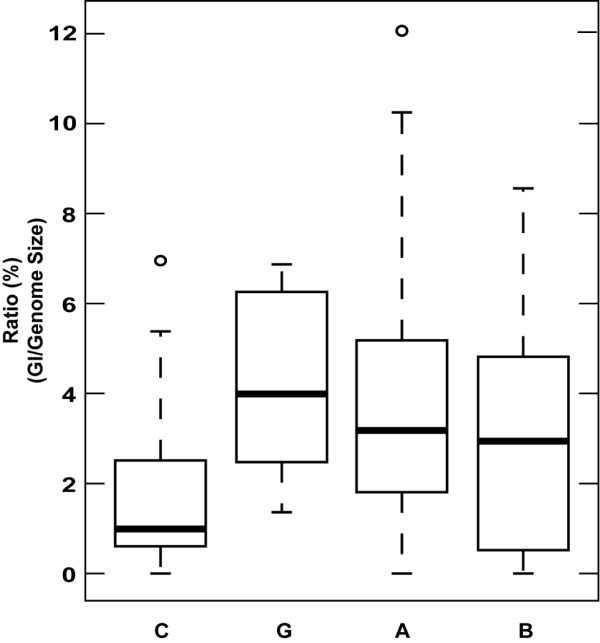
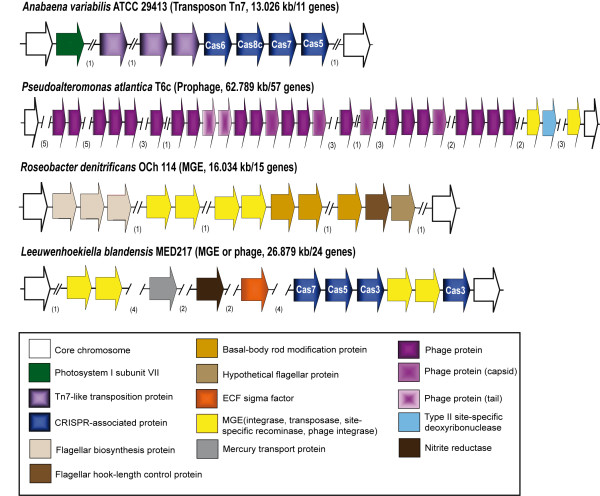
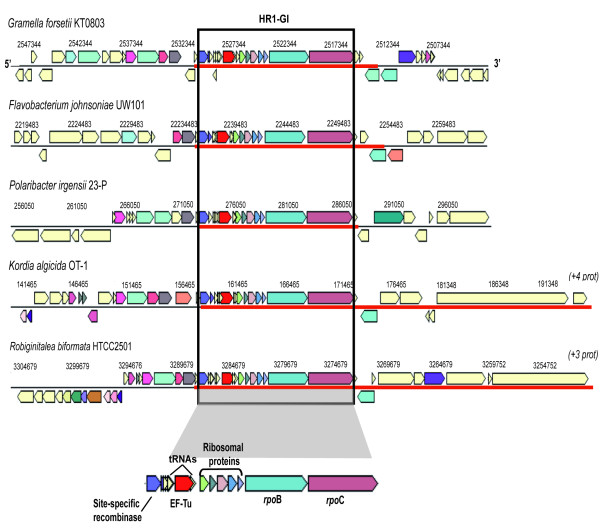
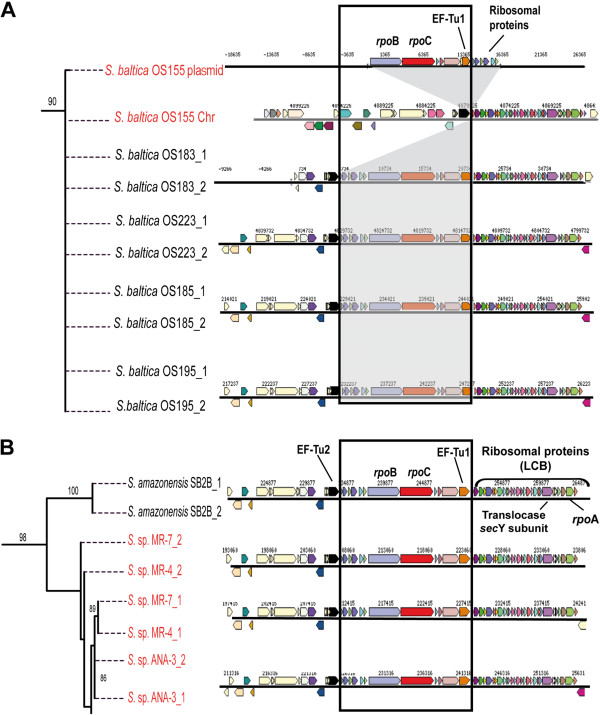
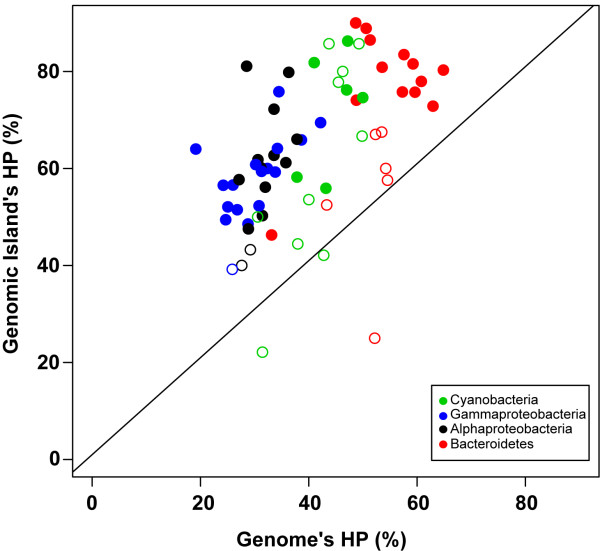
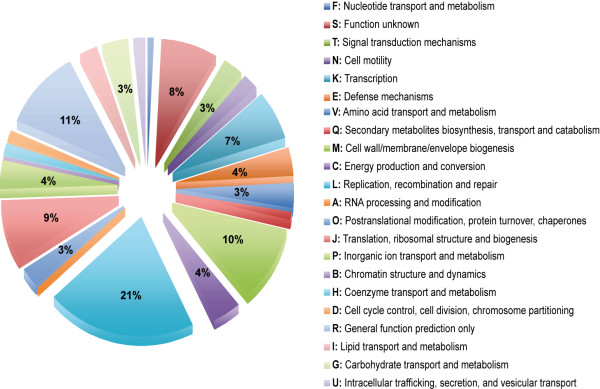
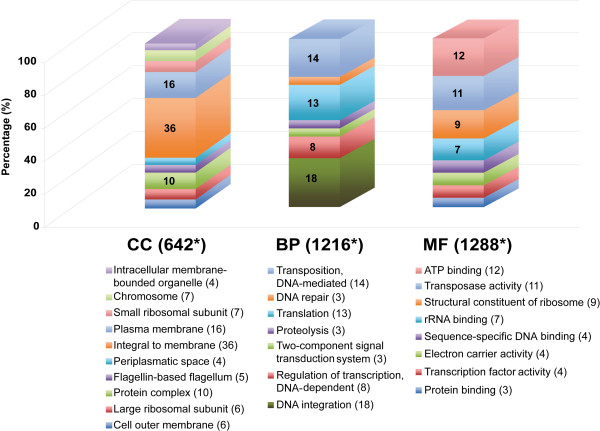
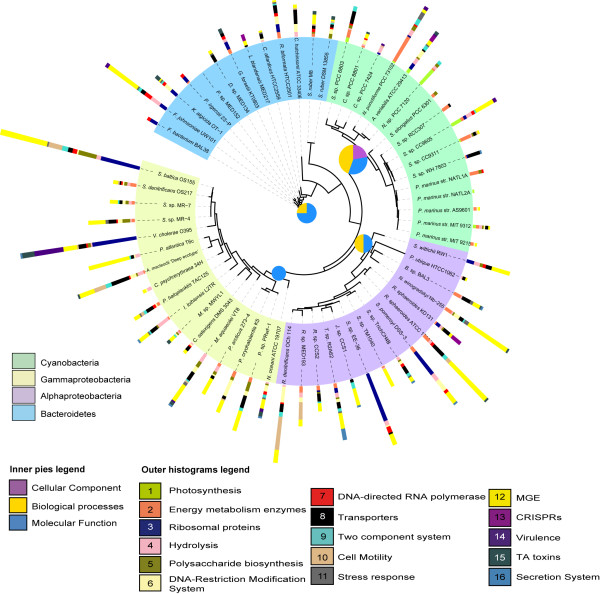
Results: We carried out a comprehensive analysis of GIs in 70 selected marine bacterial genomes detected with IslandViewer to explore the distribution, patterns and functional gene content in these genomic regions. We detected 438 GIs containing a total of 8152 genes. GI number per genome was strongly and positively correlated with the total GI size. In 50% of the genomes analyzed the GIs accounted for approximately 3% of the genome length, with a maximum of 12%. Interestingly, we found transposases particularly enriched within Alphaproteobacteria GIs, and site-specific recombinases in Gammaproteobacteria GIs. We described specific Homologous Recombination GIs (HR-GIs) in several genera of marine Bacteroidetes and in Shewanella strains among others. In these HR-GIs, we recurrently found conserved genes such as the β-subunit of DNA-directed RNA polymerase, regulatory sigma factors, the elongation factor Tu and ribosomal protein genes typically associated with the core genome.

Conclusions: Our results indicate that horizontal gene transfer mediated by phages, plasmids and other mobile genetic elements, and HR by site-specific recombinases play important roles in the mobility of clusters of genes between taxa and within closely related genomes, modulating the flexible pool of the genome. Our findings suggest that GIs may increase bacterial fitness under environmental changing conditions by acquiring novel foreign genes and/or modifying gene transcription and/or transduction.


Figures

Figure 1
Figure 1
Positions of the GIs in eight selected marine bacterial genomes used as controls. Blue bars show the GIs available in previous studies and red bars show the GIs predicted by IslandViewer. This graphic includes all GIs detected by IslandViewer although only GIs > 9.5 kb were included in our dataset for further analyses.
Figure 2
Figure 2
Patterns of GIs in marine bacterial genomes.A) Relationship between number of GIs per bacterial genome with GI size (in kb). B) Relationship between bacterial genome and GI size and C) relationship between genome size and number of GIs (≥9.5 kb).
Figure 3
Figure 3
Box- and whiskers graphic of the GI ratio (in%) for the 70 marine bacteria. Genomes are ranked from highest (12%) to lowest (0%) and grouped in 4 main phylogenetic affiliation represented as follows: C (Cyanobacteria), G (Gammaproteobacteria), A (Alphaproteobacteria) and B (Bacteroidetes). The graph shows the median (thick horizontal line), the upper and lower quartile (rectangle), the maximum and minimum values excluding outliers (discontinuous line), and finally circle represents an outlier.
Figure 4
Figure 4
Structure (5´-3´) of the Horizontal Gene Transfer (HGT)-GIs representative of four marine bacteria. Genomes belonged to Cyanobacteria, Gammaproteobacteria, Alphaproteobacteria and marine Bacteroidetes. The hypothetical origin of HGT (via prophage, transposon or other MGE), the length of the GI (in kb) and the number of genes integrated are shown in brackets. Colors indicate the variety of genes observed within the GIs. Numbers in brackets under the genes indicate the HPs and other genes not considered for the figure.
Figure 5
Figure 5
Structure (5´-3´) of the Homologous Recombination GIs (HR-GIs) in marine bacterial genomes. HR1-GI detected in five different genera of marine Bacteroidetes. The synteny and the gene cassette shared by these genomes are within the black box. Red line indicates the length of the GI detected which varied among the genomes.
Figure 6
Figure 6
Zoom of two sections of the phylogenic tree of the EF-Tu gene in Shewanella strains. The completed phylogenetic tree shows the two gene copies of the EF-Tu of 19 Shewanella strains where HR1-GI was observed marked as a black box (see Figure 4SM). A) The insertion location of the plasmid pSbal03 of Shewanella baltica OS155 in its chromosome (both labeled in red) is shown in grey and the most representative genes are indicated within HR1-GI. B) Shewanella strains labeled in red show discrepancies in the EF-Tu phylogeny when both EF-Tu genes were compared.
Figure 7
Figure 7
Percentage of HPs within the GIs and on average for each bacterial genome. Each bacterial taxon is represented by different colors. Solid circles show statistically significant differences using the corrected p-value (Bonferroni) < 0.05 after Fisher Exact Test, while empty circles did not show significant differences.
Figure 8
Figure 8
Distribution of annotated genes within the GIs according to their COG category. Percentage shown for those categories accounting for ≥3%.
Figure 9
Figure 9
Distribution of annotated genes within the GIs according to GO classification. Functional categories were split in three: Cellular Components (CC), Biological Processes (BP) and Molecular Functions (MF). Asterisk means the number of annotated genes to each main category. Numbers between parentheses indicate the percentage of appearance (only shown if ≥3%).
Figure 10
Figure 10
Phylogenetic view of the 66 bacterial genomes with GIs. The colored ring shows the four main phylogenetic groups analyzed; the histograms indicate the number of genes (in absolute number) within GIs associated with any of the 16 biological categories described. The inner pies show the functional category specifically overrepresented for Cyanobacteria, Gammaproteobacteria, Alphaproteobacteria and Flavobacteria wherein pie size is proportional to the number of GO functional categories enriched.

References

    1. Hacker J, Carniel E. Ecological fitness, genomic islands and bacterial pathogenicity. EMBO Rep. 2001;2(5):376–381. - PMC - PubMed
    1. Ochman H, Lerat E, Daubin V. Examining bacterial species under the specter of gene transfer and exchange. Proc Natl Acad Sci USA. 2005;102(1):6595–6599. doi: 10.1073/pnas.0502035102. - DOI - PMC - PubMed
    1. Doolittle WF. Lateral genomics. Trends Cell Biol. 1999;9(12):M5–M8. doi: 10.1016/S0962-8924(99)01664-5. - DOI - PubMed
    1. Boucher Y, Douady CJ, Papke RT, Walsh DA, Boudreau MER, Nesbø CL, Case RJ, Doolittle WF. Lateral gene transfer and the origins of prokaryotic groups. Annu Rev Genet. 2003;37(1):283–328. doi: 10.1146/annurev.genet.37.050503.084247. - DOI - PubMed
    1. Kettler GC, Martiny AC, Huang K, Zucker J, Coleman ML, Rodrigue S, Chen F, Lapidus A, Ferriera S, Johnson J, Steglich C, Church GM, Richardson P, Chisholm SW. Patterns and implications of gene gain and loss in the evolution of Prochlorococcus. PLoS Genet. 2007;3(12):e231. doi: 10.1371/journal.pgen.0030231. - DOI - PMC - PubMed

Publication types

LinkOut - more resources