. 2012 Jul 27:10:65.
doi: 10.1186/1741-7007-10-65.

Phylogenomic analyses support the position of turtles as the sister group of birds and crocodiles (Archosauria)

Affiliations

Phylogenomic analyses support the position of turtles as the sister group of birds and crocodiles (Archosauria)

Ylenia Chiari et al. BMC Biol. .

Abstract

Background: The morphological peculiarities of turtles have, for a long time, impeded their accurate placement in the phylogeny of amniotes. Molecular data used to address this major evolutionary question have so far been limited to a handful of markers and/or taxa. These studies have supported conflicting topologies, positioning turtles as either the sister group to all other reptiles, to lepidosaurs (tuatara, lizards and snakes), to archosaurs (birds and crocodiles), or to crocodilians. Genome-scale data have been shown to be useful in resolving other debated phylogenies, but no such adequate dataset is yet available for amniotes.

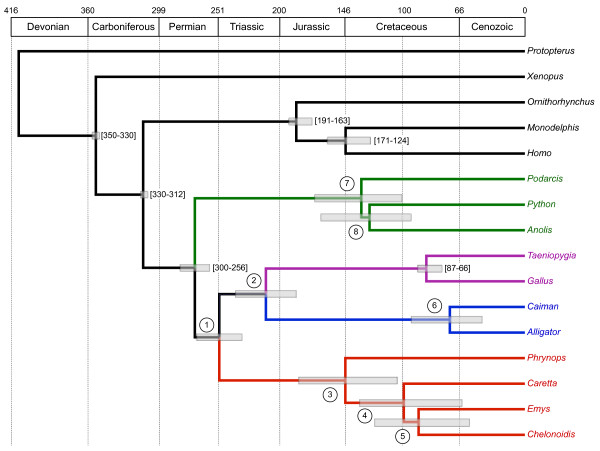
Results: In this study, we used next-generation sequencing to obtain seven new transcriptomes from the blood, liver, or jaws of four turtles, a caiman, a lizard, and a lungfish. We used a phylogenomic dataset based on 248 nuclear genes (187,026 nucleotide sites) for 16 vertebrate taxa to resolve the origins of turtles. Maximum likelihood and Bayesian concatenation analyses and species tree approaches performed under the most realistic models of the nucleotide and amino acid substitution processes unambiguously support turtles as a sister group to birds and crocodiles. The use of more simplistic models of nucleotide substitution for both concatenation and species tree reconstruction methods leads to the artefactual grouping of turtles and crocodiles, most likely because of substitution saturation at third codon positions. Relaxed molecular clock methods estimate the divergence between turtles and archosaurs around 255 million years ago. The most recent common ancestor of living turtles, corresponding to the split between Pleurodira and Cryptodira, is estimated to have occurred around 157 million years ago, in the Upper Jurassic period. This is a more recent estimate than previously reported, and questions the interpretation of controversial Lower Jurassic fossils as being part of the extant turtles radiation.

Conclusions: These results provide a phylogenetic framework and timescale with which to interpret the evolution of the peculiar morphological, developmental, and molecular features of turtles within the amniotes.


Figures

Figure 1
Figure 1
Phylogenetic relationships of amniotes as inferred from analyses of the 248-gene dataset. (a) Bayesian consensus topology obtained from analyses of the amino-acid dataset (62,342 sites) under the CAT-GTR + G4 mixture model. (b) Bayesian consensus topology obtained from analyses of the complete nucleotide dataset (187,026 sites) under the CAT-GTR + G4 mixture model. The nodal values indicate the clade Bayesian posterior probability (PP). Statistical support values obtained with different methods, models and data partitions detailed in Table 1 are reported in boxes for turtles plus archosaurs. Note the relative incongruence between the two trees concerning the position of Python. All pictures are from Wikimedia Commons, except for Chelonoidis from Y. Chiari. Please note also that the taxonomy of Galapagos turtles being currently revised, the appropriate species name for the Chelonoidis specimen included here might be Chelonoidis sp.
Figure 2
Figure 2
Analyses of substitution saturation at each codon position. Maximum likelihood saturation plots [34] were compared (a) between the complete amino-acid and nucleotide datasets, and (b) between the codon positions of the complete nucleotide dataset. The observed pairwise distances between the 16 taxa were directly computed from sequence alignments, and the corresponding inferred pairwise tree distances calculated from branch lengths of the ML topology. The Y = × line marks the theoretical limit where the number of observed substitutions equals the number of inferred substitutions. The slope of the linear regression indicates the amount of substitution saturation; the smaller the slope, the greater the number of inferred multiple substitutions.
Figure 3
Figure 3
Species trees inferred from the 248 individual maximum likelihood (ML) gene trees using a pseudo-ML approach. Maximum pseudo-likelihood for estimating species trees (MP-EST) bootstrap consensus species tree obtained for (a) the amino-acid and (b) the nucleotide dataset. (a) This consensus tree was computed from the species trees estimated by the MP-EST method for 100 bootstrap datasets of the 248 ML gene trees inferred under the LG + G8 model. (b) This consensus tree was computed from the species trees estimated by the MP-EST method for 100 bootstrap datasets of the 248 ML gene trees inferred under the GTR + G8 model. Values at nodes indicate bootstrap percentages obtained with 100 replicates. Note the strong incongruence between the two species trees concerning the position of turtles.
Figure 4
Figure 4
Bayesian relaxed molecular clock time scale. Chronogram obtained from the analysis of the nucleotide dataset using the CAT-GTR + G mixture model. Numbers in circles at nodes refer to lines of Table 3, and squared boxes represent 95% credibility intervals. Numbers between brackets represent the six calibration constraints implemented as soft bounds. Absolute ages of the geological periods follow Gradstein and Hogg [91].

References

    1. Rieppel O. In: Biology of turtles. Wyneken J, Godfrey MH, Bels V, editor. Boca Raton, FL: CRC Press, Taylor and & Francis Group; 2007. The relationships of turtles within amniotes; pp. 345–353.
    1. Burke AC. Development of the turtle carapace: implications for the evolution of a novel bauplan. J Morphol. 1989;199:363–378. doi: 10.1002/jmor.1051990310. - DOI - PubMed
    1. Burke AC. Turtles ...... again. Evol Dev. 2009;11:622–624. doi: 10.1111/j.1525-142X.2009.00369.x. - DOI - PubMed
    1. Rieppel O. Turtles as hopeful monsters. Bioessays. 2001;23:987–991. doi: 10.1002/bies.1143. - DOI - PubMed
    1. Rieppel O. How did the turtle get its shell? Science. 2009;325:154–155. doi: 10.1126/science.1177446. - DOI - PubMed

Publication types

LinkOut - more resources