. 2012 Jul 26;2(1):69-75.
doi: 10.1016/j.celrep.2012.06.013. Epub 2012 Jul 20.

Genomic imprinting absent in Drosophila melanogaster adult females

Affiliations

Genomic imprinting absent in Drosophila melanogaster adult females

Joseph D Coolon et al. Cell Rep. .

Abstract

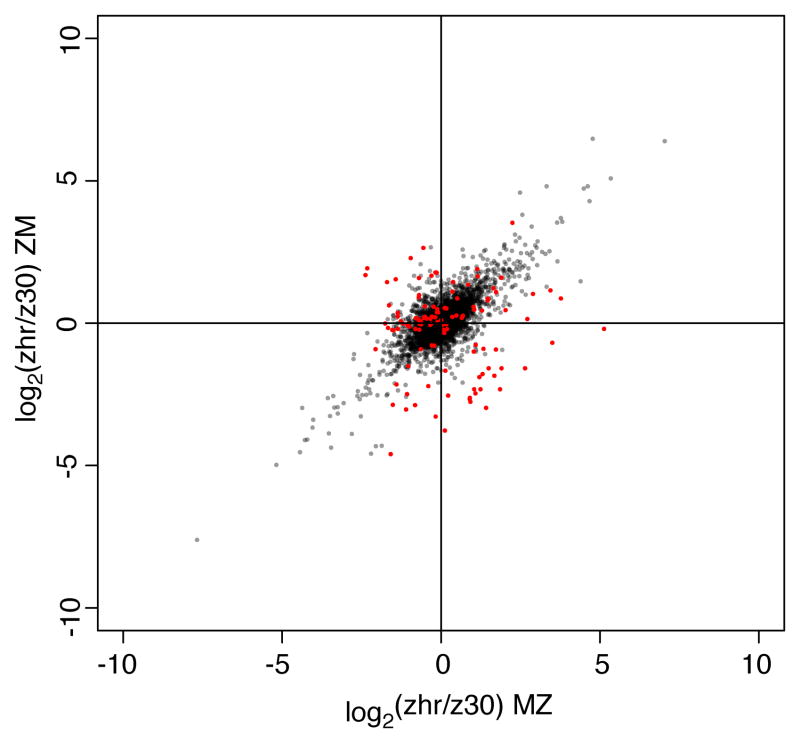
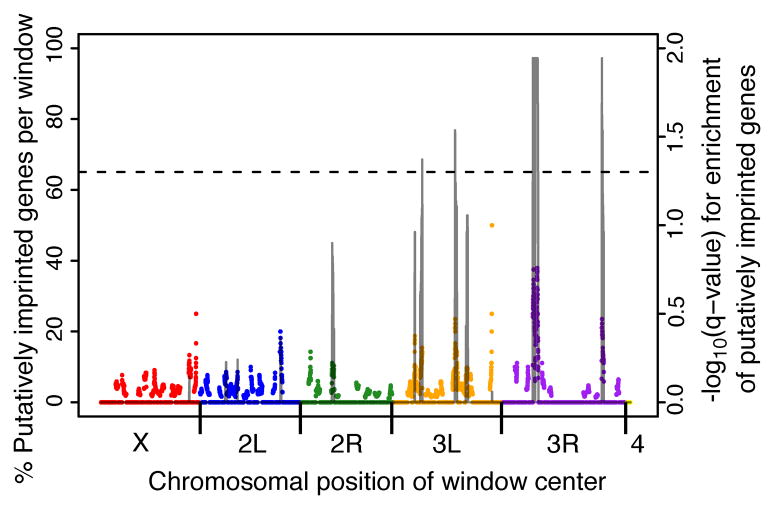
Genomic imprinting occurs when expression of an allele differs based on the sex of the parent that transmitted the allele. In D. melanogaster, imprinting can occur, but its impact on allelic expression genome-wide is unclear. Here, we search for imprinted genes in D. melanogaster using RNA-seq to compare allele-specific expression between pools of 7- to 10-day-old adult female progeny from reciprocal crosses. We identified 119 genes with allelic expression consistent with imprinting, and these genes showed significant clustering within the genome. Surprisingly, additional analysis of several of these genes showed that either genomic heterogeneity or high levels of intrinsic noise caused imprinting-like allelic expression. Consequently, our data provide no convincing evidence of imprinting for D. melanogaster genes in their native genomic context. Elucidating sources of false-positive signals for imprinting in allele-specific RNA-seq data, as done here, is critical given the growing popularity of this method for identifying imprinted genes.


Figures

Figure 1
Figure 1. Allelic expression from reciprocal crosses suggests < 2% of genes in the genome might be imprinted
Log2 transformed allelic expression ratios (zhr/z30) from MZ on the x-axis and log2(zhr/z30) allelic expression ratio from ZM on the y-axis. Each point represents one gene. Points are color-coded by significance in false discovery rate corrected Fisher’s exact tests where red points indicate q < 0.05. Note that the power to detect differences in allelic expression between ZM and MZ differs from gene-to-gene and is dependent upon the number of Illumina sequencing reads obtained that map to that gene. See also Figures S1–S3, Tables S1–S2.
Figure 2
Figure 2. Putatively imprinted genes clustered significantly on chromosomes
Using a sliding window analysis, the proportion of genes within each 500kb window that were identified as putatively imprinted is indicated for positions across the genome. Each chromosome arm is indicated on the x-axis, with one point representing each window. Using a Monte Carlo sampling approach and approximate permutation tests that control for differences in the number of genes within each window, and followed by a multiple testing correction we identified regions of the genome that were significantly enriched for PIGs. FDR corrected p-values are indicated by the solid line and the dotted line indicates the threshold used to identify significant clusters (q < 0.05).
Figure 3
Figure 3. Replicate pools of flies showed different allele frequencies in genomic DNA for putatively imprinted genes located in a cluster
For 12 genes in the region containing the largest cluster of putatively imprinted loci (7,000,000 – 8,000,000 on chromosome 3R), 7 that were identified as putatively imprinted (underlined) and 5 that were not, we used pyrosequencing to determine the relative abundance of zhr and z30 alleles in genomic DNA in additional biological replicate pools containing 20 F1 heterozygous flies each. The log2(zhr/z30) ratio is plotted for gDNA from each biological replicate pool, with the four ZM pools indicated by solid lines and the four MZ pools indicated by dotted lines. Replicates are arbitrarily colored blue, grey, red and black. The genomic arrangement of these genes is shown below the plot. Genes labeled with an asterisk were also genotyped in individual flies (Table S4). Note that CG6684 is underlined because it showed significant evidence of allelic expression differences between MZ and ZM in the RNA-seq data; however this gene does not appear to be included within the deleted region(s). Pyrosequencing analysis of CG6684 showed no evidence of differential allelic expression between MZ and ZM and normal variance among replicate biological samples, suggesting that it was a false positive in the RNA-seq data. CG5106 and CG31441 appear to be included within the deleted region, but showed no significant evidence of an imprinting-like pattern of allelic expression in the RNA-seq data, probably due to lack of power as these two genes had the lowest read counts for those tested. See also Tables S3–S4.
Figure 4
Figure 4. Putatively imprinted genes have high intrinsic noise
For each gene for each sample type (ZM or MZ) the standard error for log2 transformed allelic expression ratios from biological replicate pools of flies is shown, with black points representing genes selected at random from the genome (all of which showed no significant evidence of imprinting) and red points representing PIGs. Square marks represent the ZM sample and circles represent the MZ sample with one rank for each gene tested. The x-axis is rank of standard error for the two samples for each gene. See also Figure S4 and Table S3.

References

    1. Ahmadian A, Gharizadeh B, Gustafsson A, Sterky F, Nyren P, Uhlen M, Lundeberg J. Single-nucleotide polymorphism analysis by pyrosequencing. Anal Biochem. 2000;280:103–110. - PubMed
    1. Anaka M, Lynn A, McGinn P, Lloyd VK. Genomic Imprinting in Drosophila has properties of both mammalian and insect imprinting. Dev Genes Evol. 2009;219:59–66. - PubMed
    1. Babak T, DeVeale B, Armour C, Raymond C, Cleary MA, van der Kooy D, Johnson JM, Lim LP. Global Survey of Genomic Imprinting by Transcriptome Sequencing. Curr Biol. 2008;18:1735–1741. - PubMed
    1. Begun DJ, Aquadro CF. African and North American populations of Drosophila melanogaster are very different at the DNA level. Nature. 1993;365:548– 550. - PubMed
    1. Benjamini Y, Hochberg Y. Controlling the False Discovery Rate: a Practical and Powerful Approach to Multiple Testing. J R Stat Soc Series B Stat Methodol. 1995;57:289–300.

LinkOut - more resources