. 2012 Jul 26;2(1):111-23.
doi: 10.1016/j.celrep.2012.06.003. Epub 2012 Jun 28.

The lncRNA Malat1 is dispensable for mouse development but its transcription plays a cis-regulatory role in the adult

Affiliations

The lncRNA Malat1 is dispensable for mouse development but its transcription plays a cis-regulatory role in the adult

Bin Zhang et al. Cell Rep. .

Abstract

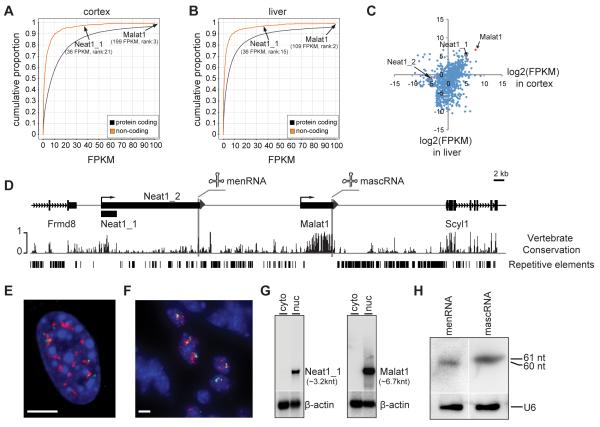
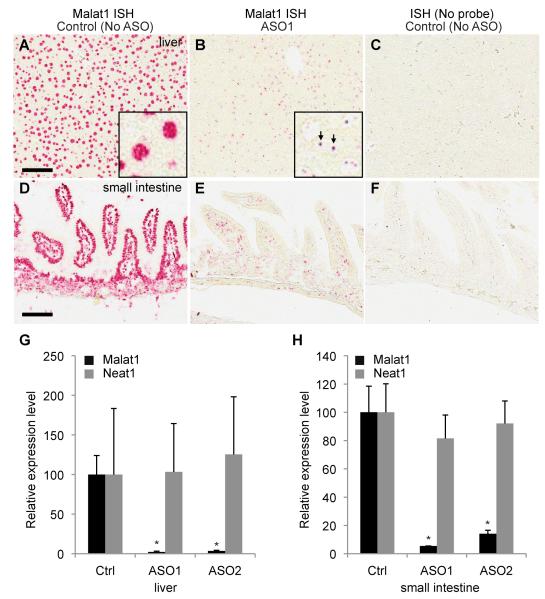
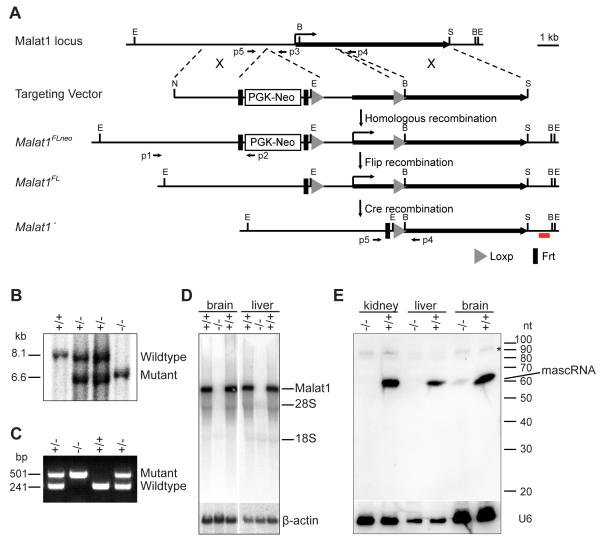
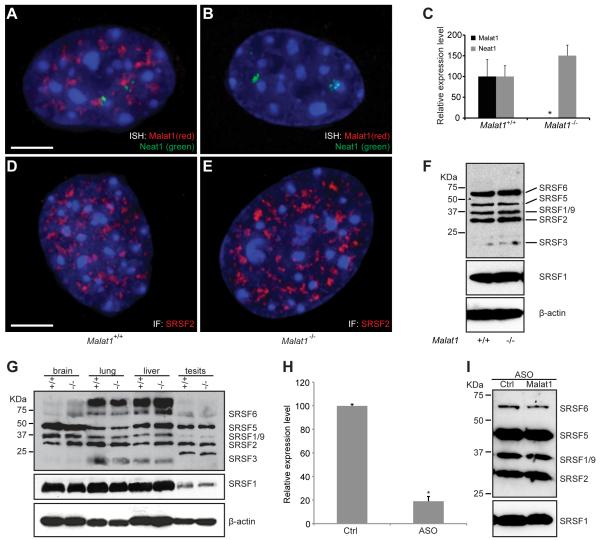
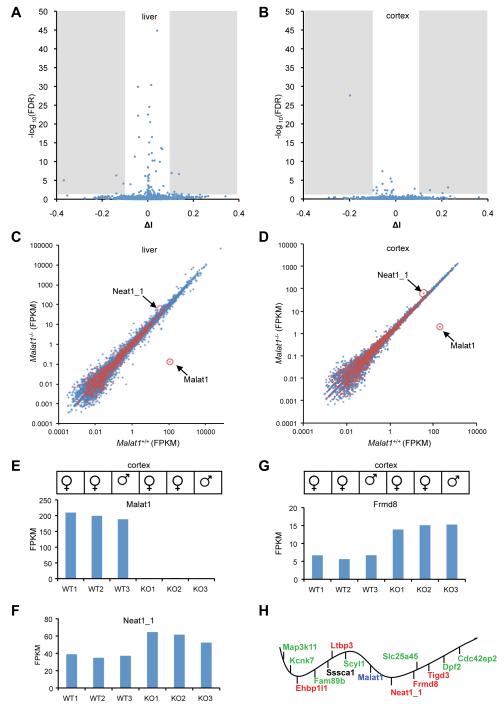
Genome-wide studies have identified thousands of long noncoding RNAs (lncRNAs) lacking protein-coding capacity. However, most lncRNAs are expressed at a very low level, and in most cases there is no genetic evidence to support their in vivo function. Malat1 (metastasis associated lung adenocarcinoma transcript 1) is among the most abundant and highly conserved lncRNAs, and it exhibits an uncommon 3'-end processing mechanism. In addition, its specific nuclear localization, developmental regulation, and dysregulation in cancer are suggestive of it having a critical biological function. We have characterized a Malat1 loss-of-function genetic model that indicates that Malat1 is not essential for mouse pre- and postnatal development. Furthermore, depletion of Malat1 does not affect global gene expression, splicing factor level and phosphorylation status, or alternative pre-mRNA splicing. However, among a small number of genes that were dysregulated in adult Malat1 knockout mice, many were Malat1 neighboring genes, thus indicating a potential cis-regulatory role of Malat1 gene transcription.


Figures

Figure 1
Figure 1. Malat1 encodes a highly abundant lncRNA in vertebrates
A-B. RNA-seq transcriptome analyses of mouse brain cortex and liver. Note that Malat1 and Neat1_1 are among the most abundant lncRNAs and that expression of Malat1 in both cortex and liver is higher than most protein-coding genes. C. Tissue-specific expression of lncRNA genes. x, y axes, log2(FPKM) values of lncRNAs in cortex and liver, respectively. D. The reverse strand of the genomic locus of mouse Chr19:5,760,586-5,860,585. Malat1 is ~40 kb downstream of Neat1. Frmd8 and Scyl1 are adjacent protein coding genes. E-F. RNA FISH shows that both Malat1 (red) and Neat1 (green) occupy distinct subnuclear domains in MEFs (E) and interstitial cells of testis (F). Blue, DAPI staining; scale bars = 5 μm. G. Northern blot analysis shows that Neat1_1 and Malat1 are enriched in the nuclear fraction and that β-actin is distributed in both cytosolic and nuclear fractions. H. small RNA Northern blot analysis shows that menRNA and mascRNA are detected in mouse liver. U6 is the loading control. Note that the blot in H is the same as that used in lanes 3 and 4 in Fig. 4E to avoid cross-hybridization of the menRNA probe to mascRNA.
Figure 2
Figure 2. Antisense knockdown of Malat1 lncRNA in adult mice does not alter organ organization
A-B. ISH analysis of Malat1 on saline-treated or Malat1 ASO1-treated livers. Malat1 is highly expressed in most liver cells (A) with its signal enriched in nuclei (inset of A). ASO1 efficiently knocks down Malat1 expression in most liver cells (B) and the remaining signals form a few distinctive dots in nuclei (arrows, inset of B), which are likely the nascent transcripts at the transcription sites of the Malat1 gene locus. C. As a negative control, probe-free ISH on the saline-treated liver shows no hybridization signals. D-E. ISH analysis of Malat1 on saline-treated or Malat1 ASO1-treated small intestine. Malat1 is highly expressed in most small intestine cells (D) with its signal enriched in nuclei. ASO1 efficiently knocks down Malat1 expression in most cell types (E). F. As a negative control, probe-free ISH on the saline-treated small intestine shows no hybridization signal. Scale bars = 100 μm. G-H. qRT-PCR analyses show that Malat1 ncRNA is significantly knocked down in ASO-treated liver (G) and small intestine (H), while Neat1 ncRNA exhibits no significant change upon Malat1 depletion in both liver (G) and small intestine (H). ISH, in situ hybridization. ASO, antisense oligonucleotide. Ctrl, control. Error bars represent S.D. (standard deviation). *, p < 0.05, Student’s unpaired t-test.
Figure 3
Figure 3. Generation and characterization of a Malat1−/− knockout mouse
A. The strategy for Malat1 targeting using homologous recombination. E, EcoRI; S, SalI; N, NotI; B, BglII; X, homologous recombination; p1, p2, p3, p4, p5 PCR primers; red line, 3′ external probe for Southern blot analysis. B, C. Southern blot (B) and PCR analyses (C) show detection of wild type and Malat1 mutant alleles. D. Northern blot analyses show that Malat1 lncRNA is depleted in homozygous mutant brain and liver. 28S and 18S indicate the positions of their size. E. Small RNA Northern blot analyses using oligo probe shows that mascRNA is depleted in Malat1 mutant liver and kidney and that a small amount of mascRNA is detected in the mutant brain. *, non-specific bands. β-actin and U6 are the loading controls.
Figure 4
Figure 4. Depletion of Malat1 lncRNA does not alter Neat1 localization, nuclear speckle morphology, or the phosphorylation status of SR proteins
A, B. RNA FISH shows the subnuclear distribution of Malat1 (red) and Neat1 (green) in wild type (A) and Malat1−/− (B) MEFs. Note that Neat1 ncRNAs form two nuclear clusters adjacent to Malat1 ncRNAs. C. qRT-PCR analysis shows that Malat1 ncRNA is depleted in Malat1−/− MEFs, while Neat1 ncRNA exhibits no significant change in the mutants as compared to wild type. Error bars represent S.D.. *, p < 0.05, Student’s unpaired t-test. D, E. Immunofluorescence labeling of SRSF2(SC35) for nuclear speckles shows no significant changes of nuclear speckle morphology, distribution, and number in the mutant (E) as compared to wild type (D) MEFs. F. Western blot analyses of phospho SR proteins labeled by 3C5 antibody and total SRSF1 labeled by anti-SRSF1 show no change of SR protein level or phosphorylation status in the mutant as compared to wild type MEFs. β-actin is the loading control. Scale bars = 5 μm. G. Western blot analyses of phospho SR proteins show no changes of SR protein phosphorylation status or total SRSF1 level in brain, lung, liver, and testis from the mutant as compared to wild type. β-actin is the loading control. H. qRT-PCR analysis shows that free-uptake ASO against MALAT1 knocks down MALAT1 lncRNA by ~80% compared to the control ASO (Ctrl) in MCF7 cells. *, p < 0.05, Student’s unpaired t-test. I. Western blot analyses of phospho SR proteins show no changes of SR protein phosphorylation status or protein level in MCF7 cells treated with the MALAT1 ASO compared to the control ASO (Ctrl).
Figure 5
Figure 5. Malat1 RNA does not regulate global pre-mRNA splicing, but its transcription inactivation alters gene expression in cis
A,B. The volcano plot shows proportional change of inclusion level (x axis, ΔI) of each exon and their statistical significance (y axis, -log10(FDR)) upon Malat1 depletion. Shaded regions represent statistical significant changes. C,D. The scatter plot shows the average expression of protein-coding (blue) and lncRNA (red) genes in wild type and Malat1 mutant livers and brain cortices. Malat1 and Neat1_1 are highlighted. E. Malat1 is significantly depleted in Malat1 mutant brain cortexes. F, G, Neat1_1 and Frmd8 show consistent overexpression in mutant cortexes. WT, wild type (Malat1+/+); KO, knockout (Malat1−/−). H. The ~240 kb genomic locus of Malat1 with adjacent genes distributed in order but not at the exact scale. Upregulated genes with statistical significance after multiple testing correction (red), and with statistical significance without multiple testing correction (green). Sssca1 expression is not significantly altered. Vertical bars under the wavy line represent transcription from the negative strand of the chromosome; vertical bars above the line represent transcription from the positive strand.

References

    1. Bernard D, Prasanth KV, Tripathi V, Colasse S, Nakamura T, Xuan Z, Zhang MQ, Sedel F, Jourdren L, Coulpier F, et al. A long nuclear-retained non-coding RNA regulates synaptogenesis by modulating gene expression. Embo J. 2010;29:3082–3093. - PMC - PubMed
    1. Bumgarner SL, Neuert G, Voight BF, Symbor-Nagrabska A, Grisafi P, van Oudenaarden A, Fink GR. Single-cell analysis reveals that noncoding RNAs contribute to clonal heterogeneity by modulating transcription factor recruitment. Molecular cell. 2012;45:470–482. - PMC - PubMed
    1. Camblong J, Iglesias N, Fickentscher C, Dieppois G, Stutz F. Antisense RNA stabilization induces transcriptional gene silencing via histone deacetylation in S. cerevisiae. Cell. 2007;131:706–717. - PubMed
    1. Castle JC, Armour CD, Lower M, Haynor D, Biery M, Bouzek H, Chen R, Jackson S, Johnson JM, Rohl CA, et al. Digital genome-wide ncRNA expression, including SnoRNAs, across 11 human tissues using polyA-neutral amplification. PLoS One. 2010;5:e11779. - PMC - PubMed
    1. Chen LL, Carmichael GG. Altered nuclear retention of mRNAs containing inverted repeats in human embryonic stem cells: functional role of a nuclear noncoding RNA. Molecular cell. 2009;35:467–478. - PMC - PubMed

Publication types

Substances