. 2012 Jul 27;47(2):183-92.
doi: 10.1016/j.molcel.2012.06.028.

DNA sequence preferences of transcriptional activators correlate more strongly than repressors with nucleosomes

Affiliations

DNA sequence preferences of transcriptional activators correlate more strongly than repressors with nucleosomes

Varodom Charoensawan et al. Mol Cell. .

Abstract

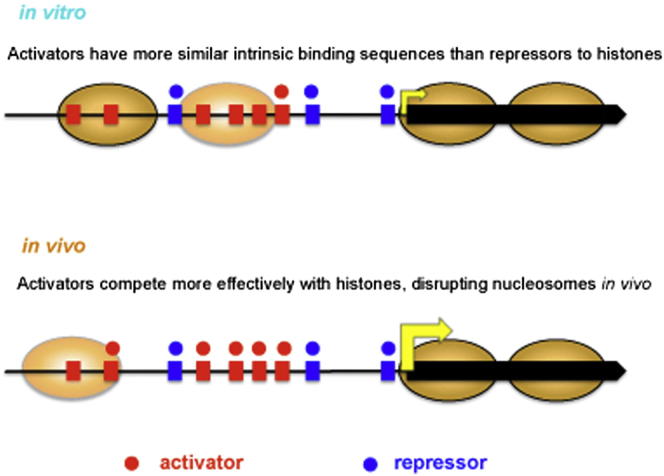
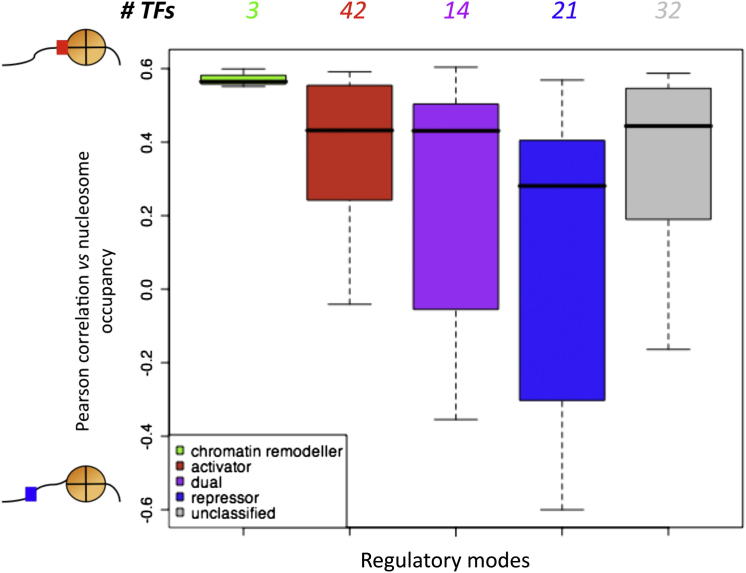
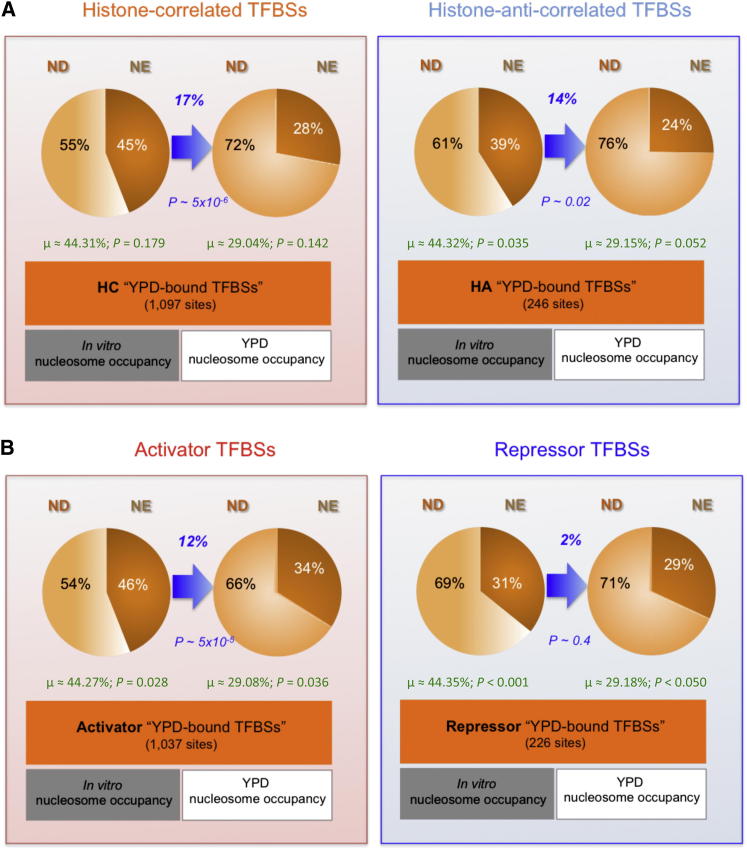
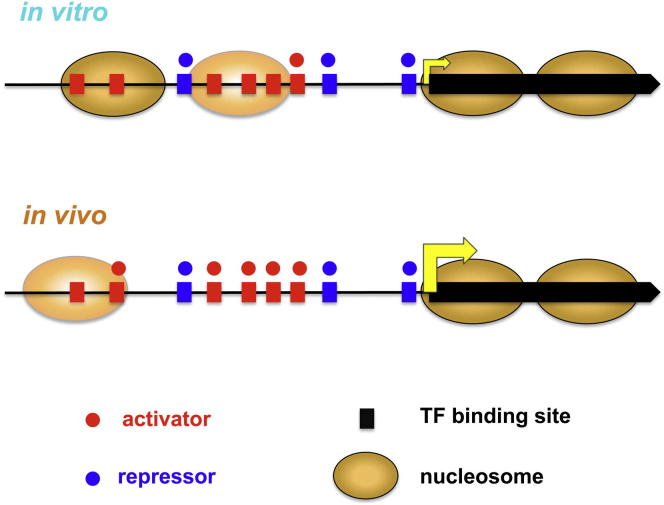
Transcription factors (TFs) and histone octamers are two abundant classes of DNA binding proteins that coordinate the transcriptional program in cells. Detailed studies of individual TFs have shown that TFs bind to nucleosome-occluded DNA sequences and induce nucleosome disruption/repositioning, while recent global studies suggest this is not the only mechanism used by all TFs. We have analyzed to what extent the intrinsic DNA binding preferences of TFs and histones play a role in determining nucleosome occupancy, in addition to nonintrinsic factors such as the enzymatic activity of chromatin remodelers. The majority of TFs in budding yeast have an intrinsic sequence preference overlapping with nucleosomal histones. TFs with intrinsic DNA binding properties highly correlated with those of histones tend to be associated with gene activation and might compete with histones to bind to genomic DNA. Consistent with this, we show that activators induce more nucleosome disruption upon transcriptional activation than repressors.


Figures

None
Graphical abstract
Figure 1
Figure 1
Summary of Data Sets Used in This Study (A) Venn diagram of the numbers of TFs, comprising DNA-binding data reported in three earlier studies (Harbison et al., 2004; Badis et al., 2008; Zhu et al., 2009). TF binding information is available (as PWMs) for 181 TFs altogether, while there are 201 PWMs from PBM experiments (Badis et al., 2008; Zhu et al., 2009), among 137 unique TFs. (B) Summary of all TF and nucleosome binding data sets used in this study. In vitro and in vivo TF binding preference data sets are highlighted in cyan and green, respectively. In vitro and in vivo nucleosome profiles are highlighted in gray and white, respectively. See also Figure S1 and Table S1.
Figure 2
Figure 2
Summary of Analysis Methods Data sets used in this study can be divided into four groups: (1) in vitro TF binding preferences from PBM experiments (Badis et al., 2008; Zhu et al., 2009), (2) in vivo TF binding sites from ChIP-chip (Harbison et al., 2004) (MacIsaac et al., 2006), and genome-wide nucleosome occupancy profiles determined (3) in vitro and (4) in vivo (Kaplan et al., 2009; Lee et al., 2007; Segal et al., 2006). In vitro TF binding preferences were used to score against the entire budding yeast genomic DNA. The predicted genome-wide TF binding preference landscapes were individually correlated against genome-wide nucleosome occupancy profile. We classified TFs into histone-correlated (HC), intermediate (I), and histone-anticorrelated (HA) groups according to these correlation coefficients (Figure 3 and Table 1). All four types of data sets were combined to compute the fractions of predicted and in vivo TFBSs likely to be occluded by nucleosomes, based on occupancy profiles in vitro and in vivo (Figure 5). See also Figure S2 and Table S1.
Figure 3
Figure 3
Histogram of Pearson Correlation Coefficients between Genome-wide Intrinsic DNA Binding Preferences of TFs and Nucleosomal Histones Out of 137 yeast TFs with available PWMs (Badis et al., 2008; Zhu et al., 2009), 93 TFs (∼70%) intrinsically prefer DNA binding sequences highly similar the regions also preferred by histones on naked DNA (i.e., histone-correlated group). The insets describe heatmaps correlating the genome-wide TF binding likelihoods of Rox1 (blue), and Abf1 (red), on the x axis, against the intrinsic nucleosome occupancy profiles on the y axis. The Pearson correlation coefficients between the two variables are −0.27 and 0.53, respectively, with the p values of linear model fitting < 2.2 × 10−16. See Figure S3A for high-resolution figures. See also Figure S3 and Tables S1, S2, and S3.
Figure 4
Figure 4
Activators Tend to Have Higher Correlation with Nucleosome Sequence Profiles than Repressors Box plots of the Pearson correlation coefficients between TF and nucleosome binding preferences, plotted separately for different regulatory modes (activator/repressor). Shown here as an example is the correlation between the binding preferences of 112 TFs (PWMs) from the Badis et al. (2008) data set against of the nucleosome occupancy profile from the Kaplan et al. (2009) data set. Numbers above the boxes indicate numbers of TFs in each category. The black bar in each box is the median correlation coefficient value, while the top edge of each box is the first quartile of the distribution, and the bottom edge the third quartile. The whiskers delimit the smallest and largest values of correlation coefficients of TFs for each regulatory mode group. Outliners are not shown. The average correlation with nucleosome binding preference profiles of activators is significantly higher than that of repressors (Mann-Whitney p value ∼0.02). See Figure S4E for the 89 PWMs from the (Zhu et al., 2009) data sets, p value ∼0.005. Please note that we focused on one PWM data set at a time for this plot due to the quantitative nature of the TF/nucleosome comparison. See also Figure S4 and Tables S2 and S3.
Figure 5
Figure 5
The Proportions of TF Binding Sites within Nucleosome-Enriched and Nucleosome-Depleted Regions The proportions of nucleosome-enriched (NE) and nucleosome-depleted (ND) TFBSs in YPD medium for HC and HA groups of TFs (A) and activators and repressors (B), based on in vitro and in vivo nucleosome occupancy profiles (Kaplan et al., 2009). Nucleosome-enriched proportions are shown in the darker shades. Focusing on the HC TFBSs in YPD, ∼55% were predicted to be nucleosome-depleted, based on the in vitro (intrinsic) nucleosome profiles. In contrast, with in vivo YPD nucleosome profiles, a significantly greater proportion of TFBSs were ND (∼17% difference, p value ∼5 × 10−6, Welch’s t test). For the HA TFBSs, the difference between the numbers of TFBSs occluded by the two nucleosome profiles (∼14%, p value ∼0.02) is less than that of the HC TFBSs. The expected averages from random shuffling experiments of nucleosome occupancies among all the YPD-bound sites, and the empirical p values that the actual values being greater or smaller than these averages are displayed in green text at the bottom of each pie chart. For activators and repressors, the difference between the numbers of nucleosome-enriched TFBSs according to in vitro and in vivo nucleosome profiles is considerably smaller for repressors (∼2%, p value ∼0.4) than activators (∼12%, p value ∼5 × 10−5). The fractions of nucleosome-enriched TFBSs of unclassified and other categories (neither activator nor repressor), and all other TFs combined are in Figure S5. See also Figure S5 and Table S2.
Figure 6
Figure 6
In Vitro and In Vivo TF and Nucleosome Binding Landscapes Based on intrinsic (in vitro) binding preferences, activators tend to have more similar DNA sequence preferences to those of nucleosomal histones, and their TFBSs might be less accessible, as compared with repressors. In yeast grown in YPD medium (in vivo), nucleosome occupancy around TFBSs of activators decreases dramatically, suggesting that activators are capable of outcompeting histones and accessing their binding sites during transcriptional activation, whereas repressors might synergize rather than compete with histones. See also Figure S6.

Similar articles

Cited by

References

    1. Badis G., Chan E.T., van Bakel H., Pena-Castillo L., Tillo D., Tsui K., Carlson C.D., Gossett A.J., Hasinoff M.J., Warren C.L. A library of yeast transcription factor motifs reveals a widespread function for Rsc3 in targeting nucleosome exclusion at promoters. Mol. Cell. 2008;32:878–887. - PMC - PubMed
    1. Bai L., Ondracka A., Cross F.R. Multiple sequence-specific factors generate the nucleosome-depleted region on CLN2 promoter. Mol. Cell. 2011;42:465–476. - PMC - PubMed
    1. Berger M.F., Philippakis A.A., Qureshi A.M., He F.S., Estep P.W., 3rd, Bulyk M.L. Compact, universal DNA microarrays to comprehensively determine transcription-factor binding site specificities. Nat. Biotechnol. 2006;24:1429–1435. - PMC - PubMed
    1. Bilu Y., Barkai N. The design of transcription-factor binding sites is affected by combinatorial regulation. Genome Biol. 2005;6:R103. - PMC - PubMed
    1. Bryant G.O., Ptashne M. Independent recruitment in vivo by Gal4 of two complexes required for transcription. Mol. Cell. 2003;11:1301–1309. - PubMed

Publication types