. 2012 Jul 27;47(2):320-9.
doi: 10.1016/j.molcel.2012.05.052.

Quantitative live cell imaging reveals a gradual shift between DNA repair mechanisms and a maximal use of HR in mid S phase

Affiliations

Quantitative live cell imaging reveals a gradual shift between DNA repair mechanisms and a maximal use of HR in mid S phase

Ketki Karanam et al. Mol Cell. .

Abstract

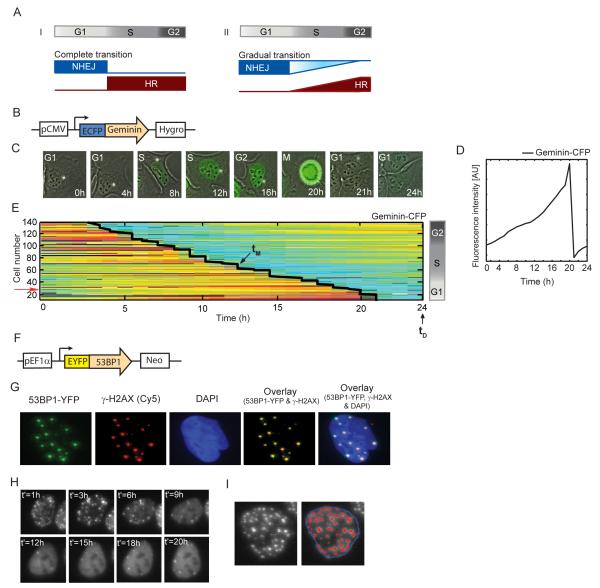
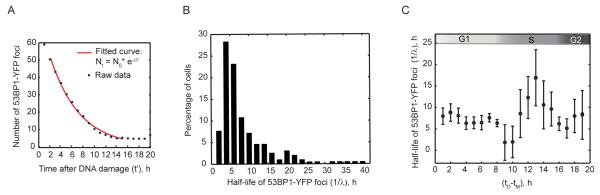
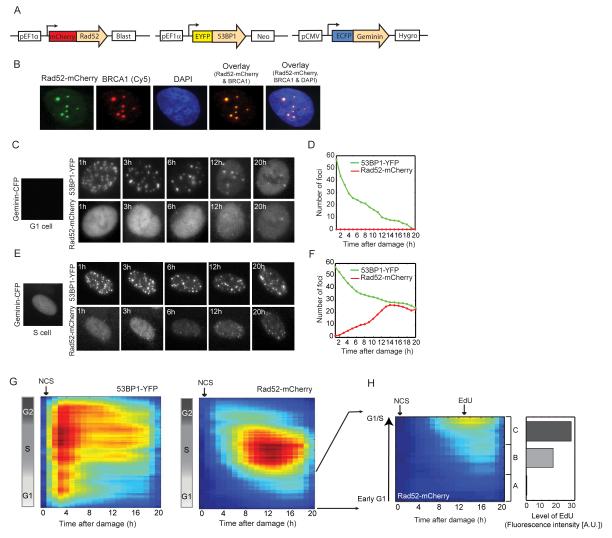
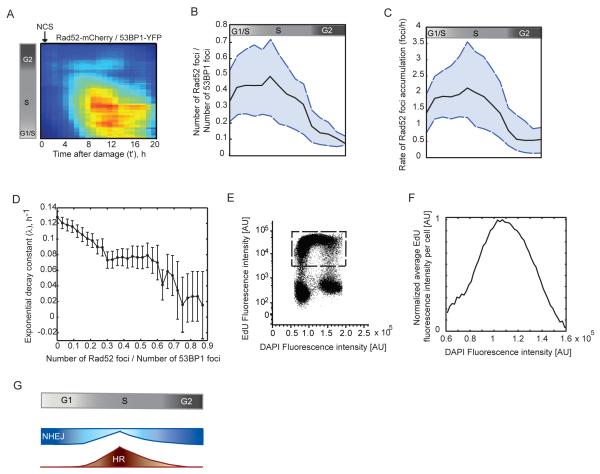
DNA double-strand breaks are repaired by two main pathways: nonhomologous end joining (NHEJ) and homologous recombination (HR). The choice between these pathways depends on cell-cycle phase; however the continuous effect of cell cycle on the balance between them is still unclear. We used live cell imaging and fluorescent reporters for 53BP1, Rad52, and cell cycle to quantify the relative contribution of NHEJ and HR at different points of the cell cycle in single cells. We found that NHEJ is the dominant repair pathway in G1 and G2 even when both repair pathways are functional. The shift from NHEJ to HR is gradual, with the highest proportion of breaks repaired by HR in mid S, where the amount of DNA replication is highest. Higher proportions of HR also strongly correlate with slower rates of repair. Our study shows that the choice of repair mechanism is continuously adjusted throughout the cell cycle and suggests that the extent of active replication, rather than the presence of a sister chromatid influences the balance between the two repair pathways in human cells.


Figures

Figure 1
Figure 1. Experimental system for quantifying DSBs and cell cycle phase in single, living cells
(A) Potential models of the transition between NHEJ and HR with cell cycle progression. The transition can be switch like (i) where cells completely shift to HR on entering S phase; or a more gradual change (ii) where cells utilize more HR with greater progress in S and G2 as the amount of replicated homologous substrate accrues. (B) Schematic drawing of the Geminin reporter. (C) Time lapse images of a freely cycling U2OS cell expressing the Geminin-CFP reporter. Images are overlays of the phase and CFP channels. (D) Quantification of the average nuclear Geminin-CFP intensity in a freely cycling cell over one cell division (indicated by the sharp drop in intensity). (E) Heat map of Geminin-CFP intensities in individual cells over time. Each horizontal line represents a single cell; blue represents low Geminin intensity; red represents high intensity. Cells were clustered according to their time of mitosis (tM, diagonal black line). Damage was applied at the 24h time point (tD). Cells at the top were in G2 when damage was applied, while cells in G1 are at the bottom. The red arrow indicates the trajectory of the cell shown in (C). (F) Schematic drawing of the 53BP1 reporter. (G) Cells expressing 53BP1-YFP were fixed and stained with anti γ-H2AX antibody after damage. The overlaid image shows co-localization between 53BP1 and γ-H2AX foci (see additional examples and quantification in Figure S1C-E). (H) Time-lapse images of a cell expressing 53BP1-YFP after damage. t’ is the time elapsed from the initiation of DNA damage. Images are maximum projections of z-stacks through the nucleus (see Experimental Procedures) in the YFP channel. (I) Example of the automated segmentation for the enumeration of 53BP1-YFP foci in a cell. Image processing was performed using the Ensemble Thresher software package developed in our lab (see experimental procedures for algorithmic details and additional examples in Figure S4). See also Figure S1.
Figure 2
Figure 2. Cell cycle position at the time of damage affects kinetics of DSB repair
(A) Enumerated 53BP1-YFP foci (black dots) and the exponential fit to the raw data (red line) for the cell shown in Figure 1H). (B) The distribution of half-lives of 53BP1-YFP foci in an unsynchronized population (n>220 cells) and as a function of cell cycle progression (C). In (C), the average half-life of 53BP1-YFP foci is plotted for cells binned according to their cell cycle position at the time of damage. The plot was calculated with a sliding window of bin size W = 2 hours. Bars represent mean + SEM for a total population of > 220 cells. See also Figure S2.
Figure 3
Figure 3. NHEJ dominates the repair of DSBs in G1 and G2 cells
(A) Schematic drawing of the Rad52, 53BP1 and Geminin reporters for quantifying HR, total DSBs and cell cycle phase respectively in individual cells. (B) U2OS cells expressing the Rad52-mCherry reporter were fixed and stained with anti-BRCA1 antibody after damage. The overlaid image shows co-localization of the Rad52-mCherry and BRCA1 foci (see additional examples and quantification in Figure S3A-C). (C, E) Time-lapse images of U2OS cells expressing the reporters in (A) that were damaged in the G1 (C) or S (E) cell cycle phases. The 53BP1-YFP and Rad52-mCherry images are maximum projections of z-stacks through the nucleus (see Experimental Procedures). (D, F) Quantification of the number of 53BP1-YFP (green) and Rad52-mCherry (red) foci in the cells shown in (C) and (E) respectively. (G) Heat maps of 53BP1-YFP and Rad52-mCherry foci as a function of time after damage (x-axis) and cell cycle progression (y-axis). Cells were binned to 20% full interval on both axes. Blue represents low foci numbers and red represents high foci numbers in a range of 0-120 (53BP1-YFP) or 0-100 (Rad52-mCherry) foci. Number of cells >140 (H) Heat map of Rad52-mCherry foci zoomed in on cells damaged in G1. The gray bars on the right indicate the average EdU content (total nuclear intensity) for cells binned into three groups A, B and C (from early to late G1) based on their cell cycle stage at the time of damage. Number of cells >40. See also Figure S3.
Figure 4
Figure 4. Contribution of HR to DSB repair changes gradually with cell cycle progression and is highest in mid-S
(A) Heat map showing the proportion of DSBs channeled to the HR repair pathway over time post damage, calculated as the ratio between Rad52-mCherry foci to 53BP1-YFP foci. The ratio is shown as a function of the time elapsed from the induction of DSBs and cell cycle progression (indicated by the reference bar on the left). Cells were binned to 20% full interval on both axes. Blue represents low ratios and red indicates a higher proportion of HR. (B) The maximum proportion of HR in individual cells post damage is plotted against their cell cycle progression at the time of damage indicated by the reference bar on top. The median (black line), 25th and 75th percentile (dashed blue lines) of the population (n> 220 cells) are shown. (C) The rate at which Rad52-mCherry foci accumulate in individual cells post damage is plotted against their cell cycle progression at the time of damage. The median (black line), 25th and 75th percentile (dashed blue lines) of the population (n> 220 cells) are shown. (D) The rate of repair as a function of HR usage is plotted for cells binned according to their maximum Rad52-mcherry/53BP1-YFP foci ratio. Cells are binned according to a bin size of 0.03. Bars represent mean + SEM. Population of n>220 cells. (E, F) The amount of DNA replication as a function of S phase progression was measured by pulse labeling cells with EdU. Levels of EdU fluorescence are shown as a function of the DAPI fluorescence (E) for a non-synchronized population of cells. The level of DNA replication is quantified as the average EdU intensity per cell. To avoid bias from non-replicating cells, (F) was calculated from cells in the window shown in (E). (G) A new model for the transition between NHEJ and HR with cell cycle progression. Cells in G1 repair DSBs exclusively by NHEJ. Cells then increase their use of HR gradually as they progress from G1 to early S. Following a peak in mid-S, HR decreases gradually as cells move towards late S and G2, with late G2 cells repairing DSBs almost entirely by NHEJ.

Similar articles

Cited by

References

    1. Anderson L, Henderson C, Adachi Y. Phosphorylation and rapid relocalization of 53BP1 to nuclear foci upon DNA damage. Mol Cell Biol. 2001;21:1719–1729. - PMC - PubMed
    1. Aylon Y, Liefshitz B, Kupiec M. The CDK regulates repair of double-strand breaks by homologous recombination during the cell cycle. Embo J. 2004;23:4868–4875. - PMC - PubMed
    1. Bekker-Jensen S, Lukas C, Kitagawa R, Melander F, Kastan MB, Bartek J, Lukas J. Spatial organization of the mammalian genome surveillance machinery in response to DNA strand breaks. J Cell Biol. 2006;173:195–206. - PMC - PubMed
    1. Bekker-Jensen S, Lukas C, Melander F, Bartek J, Lukas J. Dynamic assembly and sustained retention of 53BP1 at the sites of DNA damage are controlled by Mdc1/NFBD1. J Cell Biol. 2005;170:201–211. - PMC - PubMed
    1. Beucher A, Birraux J, Tchouandong L, Barton O, Shibata A, Conrad S, Goodarzi AA, Krempler A, Jeggo PA, Lobrich M. ATM and Artemis promote homologous recombination of radiation-induced DNA double-strand breaks in G2. Embo J. 2009;28:3413–3427. - PMC - PubMed

Publication types

Substances