Review
. 2012 Jul 26;75(2):194-208.
doi: 10.1016/j.neuron.2012.06.011.

Mechanisms of neuronal computation in mammalian visual cortex

Affiliations
Review

Mechanisms of neuronal computation in mammalian visual cortex

Nicholas J Priebe et al. Neuron. .

Abstract

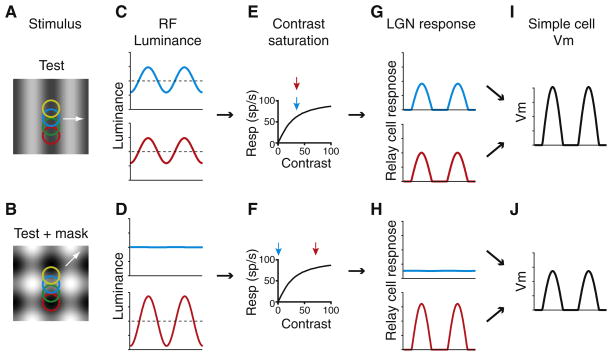
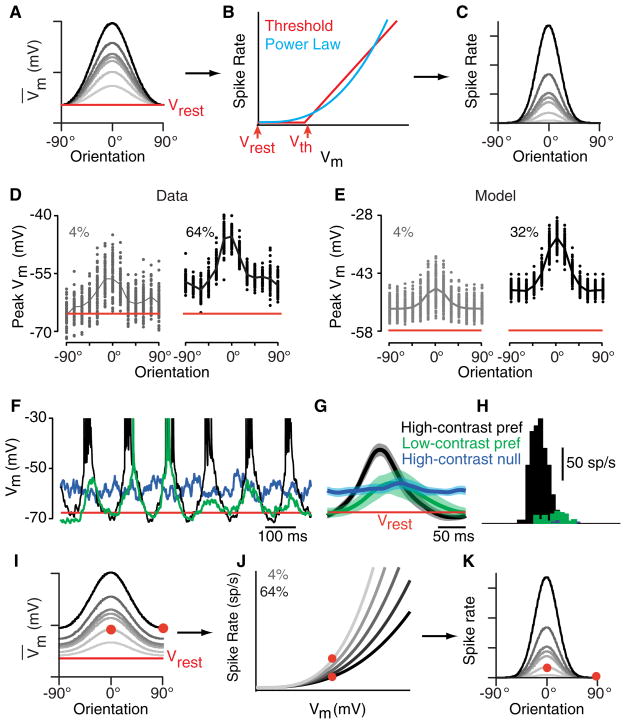
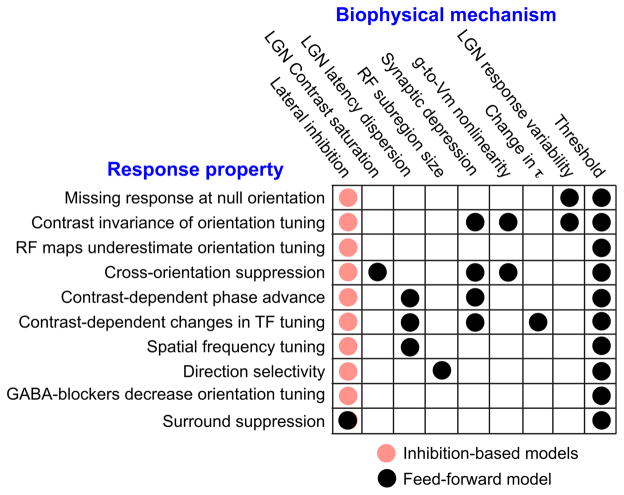
Orientation selectivity in the primary visual cortex (V1) is a receptive field property that is at once simple enough to make it amenable to experimental and theoretical approaches and yet complex enough to represent a significant transformation in the representation of the visual image. As a result, V1 has become an area of choice for studying cortical computation and its underlying mechanisms. Here we consider the receptive field properties of the simple cells in cat V1--the cells that receive direct input from thalamic relay cells--and explore how these properties, many of which are highly nonlinear, arise. We have found that many receptive field properties of V1 simple cells fall directly out of Hubel and Wiesel's feedforward model when the model incorporates realistic neuronal and synaptic mechanisms, including threshold, synaptic depression, response variability, and the membrane time constant.


Figures

Figure 1
Figure 1. The Feedforward Model of Orientation Selectivity in Primary Visual Cortex
(A) The feedforward model as originally proposed by Hubel and Wiesel (1962). Four relay cells from the LGN (top right), whose receptive fields are shown to the left, synapse onto a V1 simple cell (bottom right). The simple cell derives its preferred orientation from the axis of alignment of these relay cell receptive fields and others like them that are not shown. (B) The response of the feedforward model to drifting gratings in the preferred orientation (top) and the orthogonal orientation (bottom). LGN neurons with spatially offset receptive fields respond synchronously for the preferred orientation and asynchronously for the orthogonal orientation (middle panels). The average feedforward input increases in response to both stimuli, but only the preferred orientation response is sufficient to cross threshold (dotted lines) and evoke action potentials (right panels). (C) The spatial relationship between the receptive fields of 23 recorded LGN relay cells (circles) and the receptive field of their postsynaptic simple cells (ovals). Each simple cell receptive field, along with its presynaptic LGN cell receptive fields, have been scaled and shifted to superimpose on an idealized receptive field. The image is adapted from Reid and Alonso (1995). Not shown is a tendency for LGN cells overlapping the center of a simple cell subregion to make stronger connections than those overlapping the periphery of the subregions. (D) The receptive fields of two different sets of LGN relay cells that terminate in one column of V1 (circles), superimposed on the receptive field of a V1 simple cell recorded in layer 4 of the same column (square). The image is adapted from Chapman et al. (1991).
Figure 2
Figure 2. Cross-orientation Suppression in a Feedforward Model of Visual Cortex
(A and B) The spatial receptive fields of LGN relay cells (colored circles) are superimposed on top of a 32% contrast vertical grating (A) or a plaid composed of 32% horizontal and vertical gratings (B). (C and D) Stimulus luminance is plotted as a function of time for two LGN relay cells, indicated by color (C, grating; D, plaid). (E and F) The contrast response curve of LGN relay cells. The arrows indicate the contrast passing over each relay cell’s receptive field (E, grating; F, plaid). (G and H) The modeled responses of the relay cells based on the contrast passing over their receptive fields include both saturation and rectification (G, grating; H, plaid). (I and J) The average input to a target V1 simple cell. The average relay cell input is about 10% less for the plaid stimulus (I) than for the grating stimulus (J).
Figure 3
Figure 3. Contrast Invariance of Orientation Tuning
(A) Orientation tuning curves of a simple cell derived from a simple feedforward model for different stimulus contrasts. Red dots indicate the high-contrast null-oriented stimulus and the low-contrast preferred stimulus. (B) A threshold-linear relationship between Vm and spike rate. (C) The predicted orientation tuning curves for spike rate. (D) Tuning curves for spike rate in real recorded V1 simple cells show nearly identical width at all contrasts and zero response at the null orientation. (E and F) Orientation tuning curves for Vm (E) and spike rate (F) at 4% (gray) and 64% (black) contrast recorded intracellularly from a simple cell in cat V1. This cell probably received the bulk of its synaptic input from the LGN, as indicated by the significant depolarization at the null orientation (E). (G and H) Vm (G) and spike (H) responses at 4% and 64% contrast for a simple cell that probably received the bulk of its synaptic input from other orientation-selective cortical cells, since it shows no depolarization at the null orientation (G). All response amplitudes are measured at the peak of the depolarization or spike rate increase evoked by a stimulus, which we derive from the mean response plus the amplitude of the response harmonic component at the stimulus frequency (DC + F1).
Figure 4
Figure 4. Trial-to-Trial Response Variability and the Origin of Contrast-Invariant Orientation Tuning in Simple Cells
(A–C) A power-law relationship between Vm and spike rate (B) will transform a set of Gaussian orientation tuning curves for Vm with identical widths (A) into a set of Gaussian tuning curves for spike rate, again with identical, but narrower, widths (C). Tuning curves with no offset from rest, as in (A), are typical of cells dominated by cortical input. (D) Amplitudes of individual Vm responses (points) and mean response amplitude (curve) for low and high contrasts recorded intracellularly from a simple cell. (E) Same as (D) but derived from a feedforward model as described in the text. (F) Intracellularly recorded Vm responses to six cycles of a grating at three different combinations of orientation and contrast. (G) Average and trial-to-trial standard deviation (shading) for the three stimuli. (H) Average spike responses for the three stimuli. (I–K) As in (A)–(C), for a simple cell dominated by input from the LGN. The Gaussian-shaped tuning curves for Vm therefore ride on a contrast-dependent offset (I). In order to achieve contrast-invariant orientation tuning of the spike rate responses (K), the relationship between Vm and spike rate must be contrast dependent (J), as determined by the contrast dependence of trial-to-trial variability (D).
Figure 5
Figure 5. The Match between Measured Width of Orientation Tuning and that Predicted by Receptive Field Maps
(A and B) Simple cell receptive field maps based on spike rate (A) and membrane potential (B) are generally matched. Red indicates spatial locations with preference for OFF and green indicates preference for ON. (C) Orientation tuning curves measured from peak spike rate (black) are narrower than those predicted from receptive field maps (blue). (D) Measured and predicted tuning curves are matched for membrane potential. (E) Population data showing the mismatch between measured and predicted tuning width in spike rate data (replotted from Gardner et al., 1999). (F) Population data showing the match between measured and predicted tuning width in membrane potential data (replotted from Lampl et al., 2001).
Figure 6
Figure 6. The Change in Temporal Frequency Tuning between LGN and Cortex
(A–C) Temporal frequency tuning for peak response at two different contrasts for an LGN cell (A), and the Vm responses (B), and spike rate responses (C) of a V1 simple cell. (D) Response phase versus temporal frequency for three different LGN cells. (E) A histogram of the visual latency for 23 LGN cells, where visual latency is the slope of the relationship between phase and TF, as in (D). (F) Averaged single-cycle responses of 23 LGN cells to drifting gratings at four different TFs (gray). The responses have been shifted to have identical temporal phases at the stimulus frequency. The responses of all 23 cells are then averaged to model the input to a simple cell (black). (G) As in (F), but here the LGN responses are shifted relative to one another according to their visual latencies (D and E). (H) A comparison of the model simple cell responses from (F) and (G). (I) Temporal frequency tuning curves from a model simple cell. Moving from right to left, for each curve one additional mechanism has been added to the model as indicated by the color code.
Figure 7
Figure 7. The Contrast-Dependent Change in Response Timing
(A and B) Spike rate (A) and Vm (B) responses of a simple cell to drifting gratings (TF = 2 Hz) at six different contrasts (0%, 4%, 8%, 16%, 32%, and 64%). Amplitude increases and phase advances with increasing contrast. (C and D) Vm and spike rate responses super-imposed for 64% (C) and 4% (D) contrast to show the relative phase shift between the two. (E) Response phase (relative to Vm response at 64%) as a function of contrast for the records in (A) and (B). (F) Response phase as a function of contrast for three different simple cell models: LGN responses synchronized in phase and averaged, LGN responses shifted according to visual latency and averaged, and LGN responses shifted and then passed through a model of synaptic depression.
Figure 8
Figure 8. The Biophysical Mechanisms Underlying the Response Properties of V1 Simple Cells
Inhibitory models propose that all of a simple cell’s nonlinear properties arise from intracortical synaptic inhibition that is either unselective for orientation or selective for the orthogonal orientation to the feedforward input (red points). Alternatively, a simple feedforward model incorporating experimentally determined nonlinear processes can account for most of the behavior of simple cells. Black points indicate which mechanisms contribute to which simple cell properties.

Similar articles

Cited by

References

    1. Albrecht DG. Visual cortex neurons in monkey and cat: effect of contrast on the spatial and temporal phase transfer functions. Vis Neurosci. 1995;12:1191–1210. - PubMed
    1. Alitto HJ, Usrey WM. Influence of contrast on orientation and temporal frequency tuning in ferret primary visual cortex. J Neurophysiol. 2004;91:2797–2808. - PubMed
    1. Alonso JM, Martinez LM. Functional connectivity between simple cells and complex cells in cat striate cortex. Nat Neurosci. 1998;1:395–403. - PubMed
    1. Anderson JS, Carandini M, Ferster D. Orientation tuning of input conductance, excitation, and inhibition in cat primary visual cortex. J Neurophysiol. 2000;84:909–926. - PubMed
    1. Atallah BV, Bruns W, Carandini M, Scanziani M. Parvalbumin-expressing interneurons linearly transform cortical responses to visual stimuli. Neuron. 2012;73:159–170. - PMC - PubMed

Publication types