

From functional architecture to functional connectomics
- PMID: 22841307
- PMCID: PMC3876951
- DOI: 10.1016/j.neuron.2012.06.031
From functional architecture to functional connectomics
Abstract
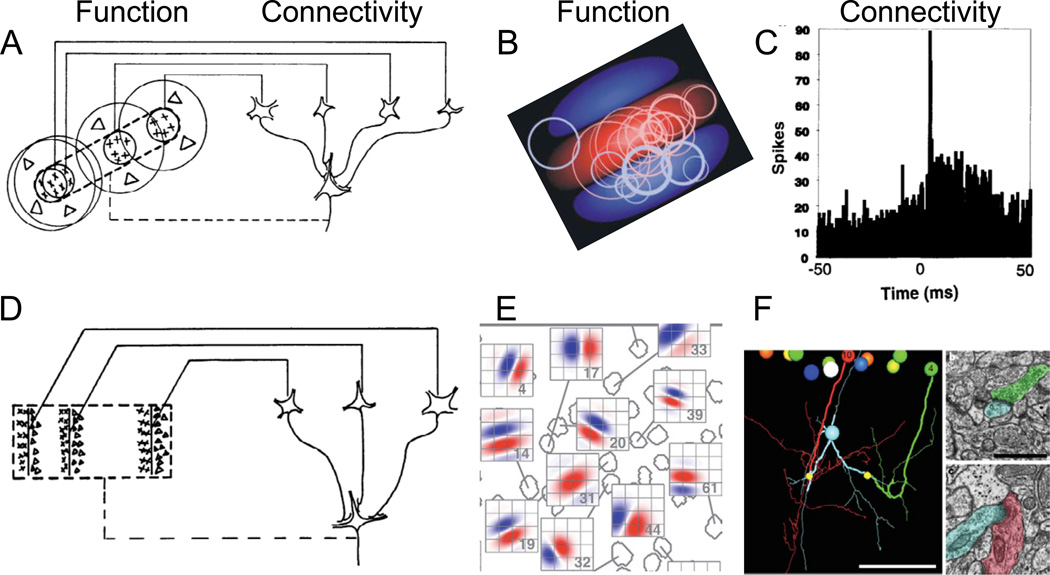
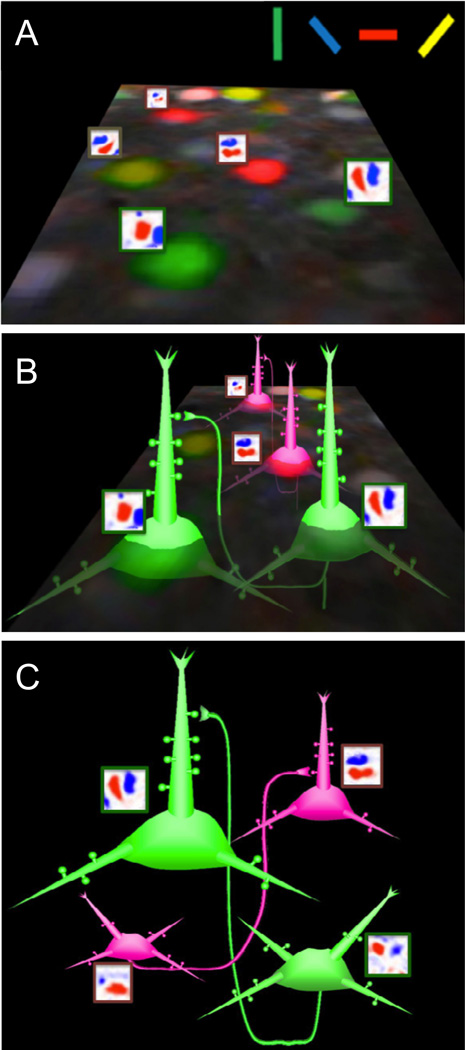
"Receptive Fields, Binocular Interaction and Functional Architecture in the Cat's Visual Cortex" by Hubel and Wiesel (1962) reported several important discoveries: orientation columns, the distinct structures of simple and complex receptive fields, and binocular integration. But perhaps the paper's greatest influence came from the concept of functional architecture (the complex relationship between in vivo physiology and the spatial arrangement of neurons) and several models of functionally specific connectivity. They thus identified two distinct concepts, topographic specificity and functional specificity, which together with cell-type specificity constitute the major determinants of nonrandom cortical connectivity. Orientation columns are iconic examples of topographic specificity, whereby axons within a column connect with cells of a single orientation preference. Hubel and Wiesel also saw the need for functional specificity at a finer scale in their model of thalamic inputs to simple cells, verified in the 1990s. The difficult but potentially more important question of functional specificity between cortical neurons is only now becoming tractable with new experimental techniques.
Copyright © 2012 Elsevier Inc. All rights reserved.
Figures
Similar articles
-
Population receptive fields of ON and OFF thalamic inputs to an orientation column in visual cortex.Nat Neurosci. 2011 Feb;14(2):232-8. doi: 10.1038/nn.2729. Epub 2011 Jan 9. Nat Neurosci. 2011. PMID: 21217765
-
Computational modeling of orientation tuning dynamics in monkey primary visual cortex.J Comput Neurosci. 2000 Mar-Apr;8(2):143-59. doi: 10.1023/a:1008921231855. J Comput Neurosci. 2000. PMID: 10798599
-
Orientation selectivity of thalamic input to simple cells of cat visual cortex.Nature. 1996 Mar 21;380(6571):249-52. doi: 10.1038/380249a0. Nature. 1996. PMID: 8637573
-
Thalamocortical specificity and the synthesis of sensory cortical receptive fields.J Neurophysiol. 2005 Jul;94(1):26-32. doi: 10.1152/jn.01281.2004. J Neurophysiol. 2005. PMID: 15985693 Review.
-
Laminar processing in the visual cortical column.Curr Opin Neurobiol. 2006 Aug;16(4):377-84. doi: 10.1016/j.conb.2006.06.014. Epub 2006 Jul 13. Curr Opin Neurobiol. 2006. PMID: 16842989 Review.
Cited by
-
Statistical perspective on functional and causal neural connectomics: The Time-Aware PC algorithm.PLoS Comput Biol. 2022 Nov 14;18(11):e1010653. doi: 10.1371/journal.pcbi.1010653. eCollection 2022 Nov. PLoS Comput Biol. 2022. PMID: 36374908 Free PMC article.
-
Structural Connectivity Fingerprints Predict Cortical Selectivity for Multiple Visual Categories across Cortex.Cereb Cortex. 2016 Apr;26(4):1668-83. doi: 10.1093/cercor/bhu303. Epub 2015 Jan 26. Cereb Cortex. 2016. PMID: 25628345 Free PMC article.
-
Connectomic constraints on computation in feedforward networks of spiking neurons.J Comput Neurosci. 2014 Oct;37(2):209-28. doi: 10.1007/s10827-014-0497-5. Epub 2014 Apr 3. J Comput Neurosci. 2014. PMID: 24691897
-
Wiring visual systems: common and divergent mechanisms and principles.Curr Opin Neurobiol. 2017 Feb;42:128-135. doi: 10.1016/j.conb.2016.12.006. Epub 2017 Jan 5. Curr Opin Neurobiol. 2017. PMID: 28064004 Free PMC article. Review.
-
Development and plasticity of the primary visual cortex.Neuron. 2012 Jul 26;75(2):230-49. doi: 10.1016/j.neuron.2012.06.009. Neuron. 2012. PMID: 22841309 Free PMC article. Review.
References
Publication types
MeSH terms
Grants and funding
LinkOut - more resources
Full Text Sources
Miscellaneous
