. 2012 Jul 26;75(2):342-51.
doi: 10.1016/j.neuron.2012.03.041.

Coding of the reach vector in parietal area 5d

Affiliations

Coding of the reach vector in parietal area 5d

Lindsay R Bremner et al. Neuron. .

Abstract

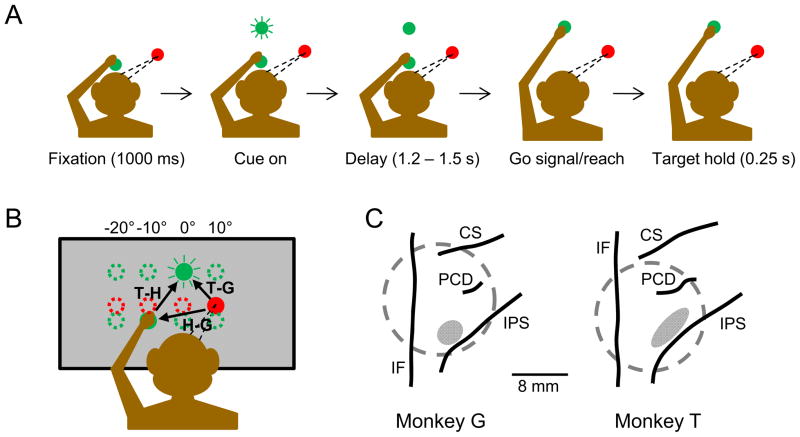
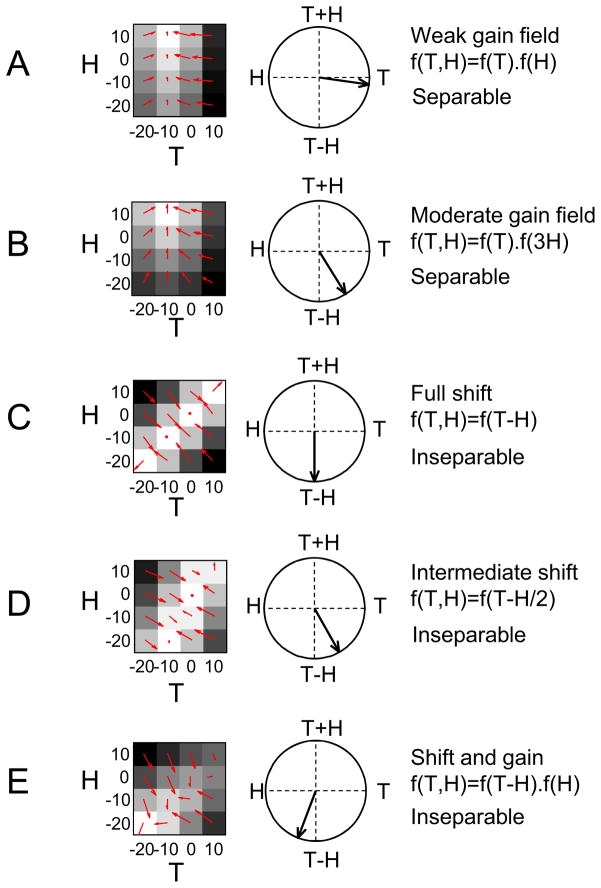
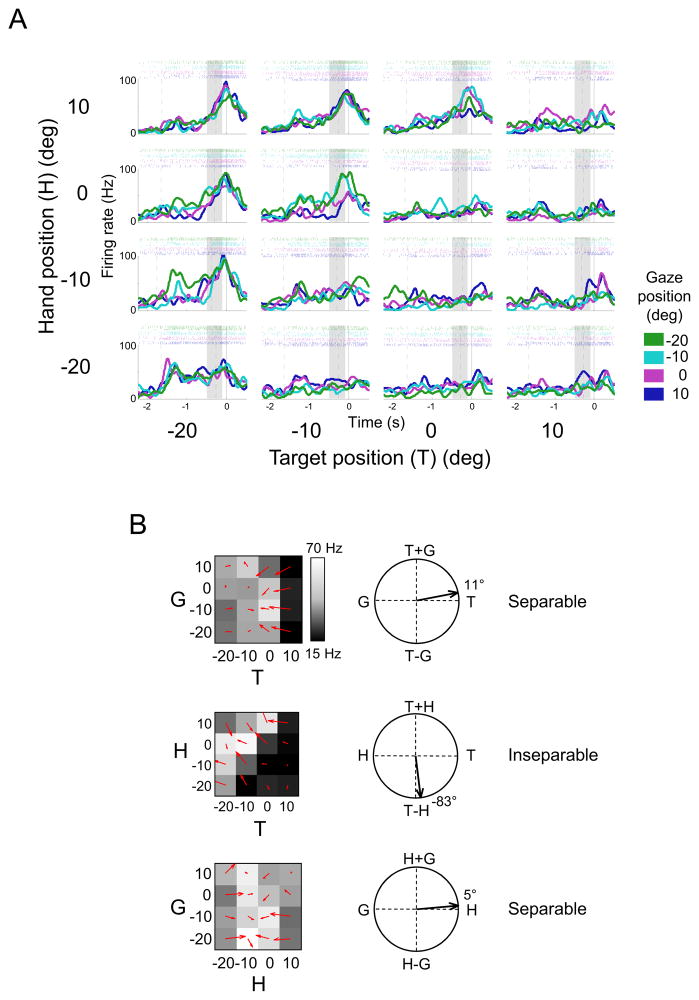
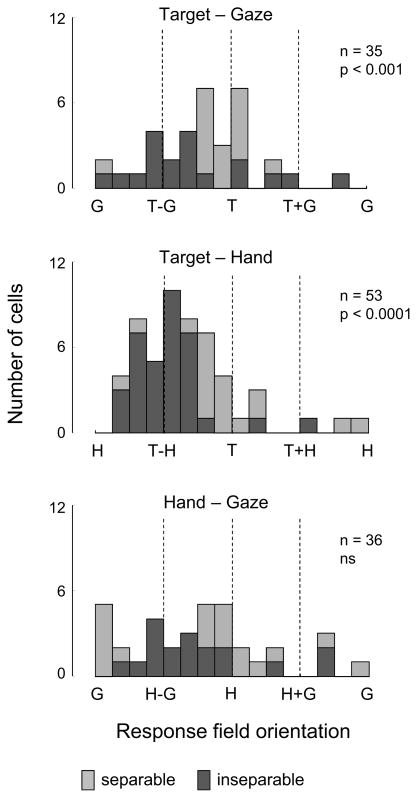
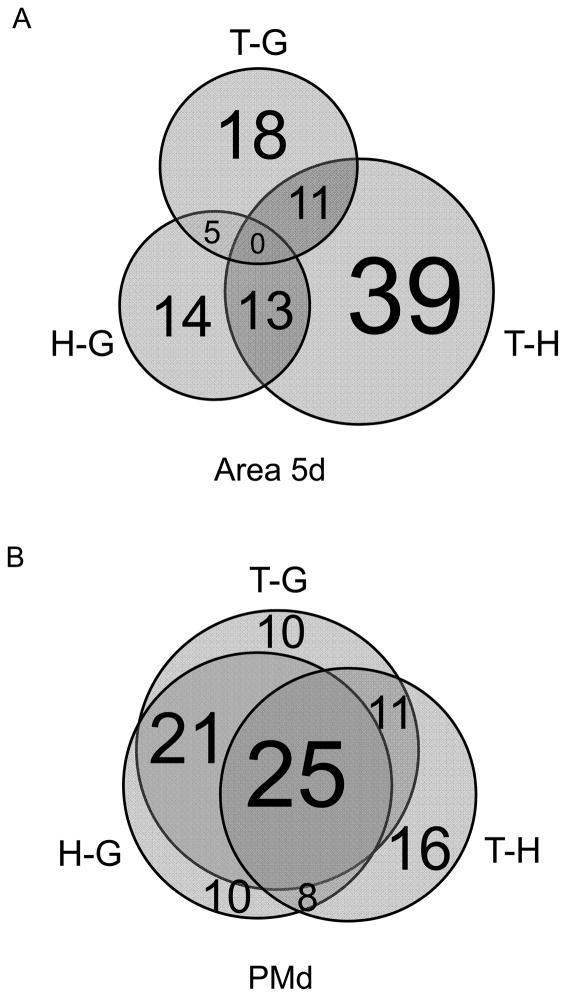
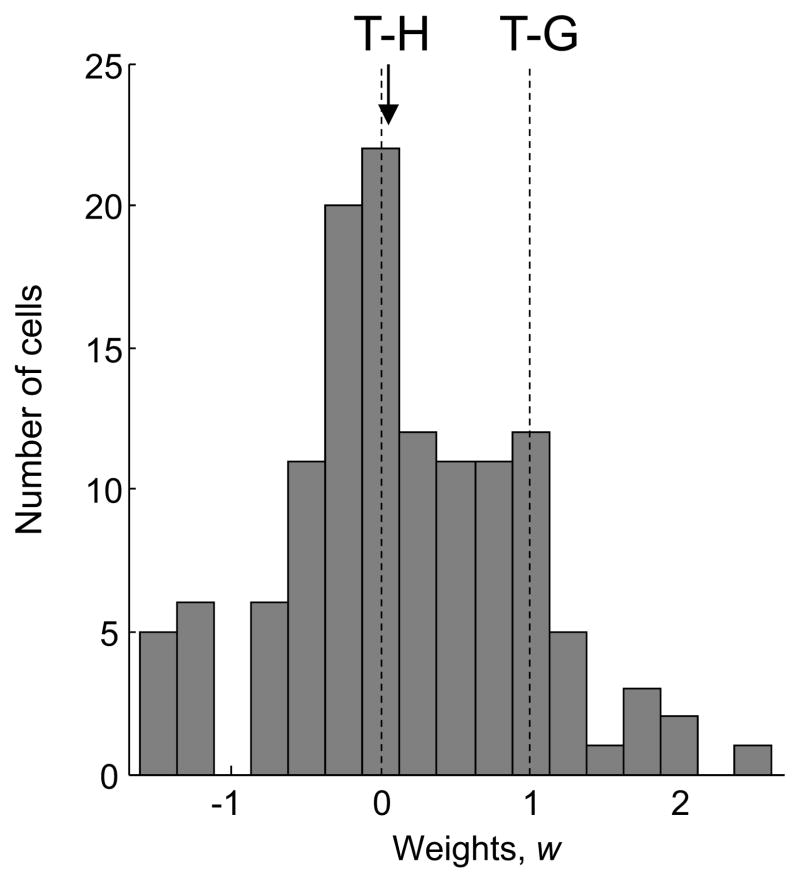
Competing models of sensorimotor computation predict different topological constraints in the brain. Some models propose population coding of particular reference frames in anatomically distinct nodes, whereas others require no such dedicated subpopulations and instead predict that regions will simultaneously code in multiple, intermediate, reference frames. Current empirical evidence is conflicting, partly due to difficulties involved in identifying underlying reference frames. Here, we independently varied the locations of hand, gaze, and target over many positions while recording from the dorsal aspect of parietal area 5. We find that the target is represented in a predominantly hand-centered reference frame here, contrasting with the relative code seen in dorsal premotor cortex and the mostly gaze-centered reference frame in the parietal reach region. This supports the hypothesis that different nodes of the sensorimotor circuit contain distinct and systematic representations, and this constrains the types of computational model that are neurobiologically relevant.


Figures

Figure 1
Figure 1. The Experimental Design and Recording Sites
(A) The time-line of the delayed reaching task for a single trial (see Experimental Procedures for details). (B) The geometry of the reference frame task. The monkey was trained to reach from one of four possible starting hand positions to one of four targets (green circles), whilst maintaining gaze fixation at one of four locations (red circles). Fixation positions and targets were 10 degrees (approximately 5 cm) apart horizontally in screen-centered coordinates. (C) Location of the recording zones for each monkey, estimated from structural magnetic resonance images. CS – central sulcus; IPS – intraparietal sulcus; PCD – postcentral dimple; IF – interhemispheric fissure; dotted gray circle – recording chamber; shaded ellipse – recording zone.
Figure 2
Figure 2. Gain Field and Vector Relationships Illustrated in Simulated Cells
(A) A cell with a weak gain field of hand (H) on target (T). (B) A cell with a moderate gain field of H on T. (C) A cell with a vector relationship between H and T (full shift). (D) A cell with a vector relationship between H and T (intermediate shift. (E) A cell with a vector relationship between H and T plus a superimposed H gain field. Left panels show idealized matrix responses for a pair of variables (illustrated here with H and T). White represents a high firing rate and black represents a low firing rate. Small red arrows denote the gradient of each matrix response field. Center panels show the overall response field orientation calculated from the red gradient arrows. The response field orientation indicates the relative influence of each variable on the firing rate of the cell. Right panels list how each simulated cell was modeled and whether each type of relationship is categorized as separable or inseparable in the singular value decomposition analysis.
Figure 3
Figure 3. Example Area 5d Cell with Hand-Centered Reference Frame
(A) Peristimulus time histograms and raster plots for the sixty-four conditions. Each of the sixteen subplots shows the response of the neuron to a particular combination of target position (T) and hand position (H) at the four different gaze locations (G). For example, the top left plot shows trials in which the target was located at −20 deg, the hand started at 10 deg, and the gaze was fixed at −20 deg (green line), −10 deg (cyan line), 0 deg (purple line) or 10 deg (dark blue line). Trials are aligned to movement onset (solid vertical line in each subplot), with the first and second dashed lines indicating mean times for cue onset and the go signal, respectively. The shaded bar indicates the late delay period used in the analysis. For this cell, gaze position only weakly influenced the firing of the cell so the colored traces largely overlap in each subplot. (B) Matrices and response field orientations for the cell shown in A. Top: the target – gaze matrix (hand at 10 deg, formed from the top row of subplots in A). Middle: the target – hand matrix (gaze at −10 deg, formed from all the cyan traces in A). Bottom: the gaze – hand matrix (target at −20 deg, formed from the left-most column of subplots in A). Figure S1 shows the full complement of twelve matrices for this cell.
Figure 4
Figure 4. Area 5d Predominantly Codes the Reach Vector: Target – Hand
Histograms show the response field orientations for the population of tuned cells for each pair of variables. Stacked bars represent inseparable (dark grey) or separable (light grey) responses. p values reflect the result of the Kuiper test for uniformity. The dominance of T – H coding is also present away from the response field peak (see Figure S2).
Figure 5
Figure 5. Coding in Area 5d is Distinct from that in Dorsal Premotor Cortex
The percentage of tuned, inseparable cells that code each vector in (A) area 5d and (B) dorsal premotor cortex. (Data in Figure 5B taken from Pesaran et al. 2010)
Figure 6
Figure 6. Distribution of Weights in the Parametric Modeling Analysis
The arrowhead indicates the median weight value, 0.04. The distribution is similar for cells with a peak in the working range and cells with r2 greater than 0.6 (Figure S3).

References

    1. Andersen RA, Bracewell RM, Barash S, Gnadt JW, Fogassi L. Eye position effects on visual, memory, and saccade-related activity in areas LIP and 7a of macaque. J Neurosci. 1990;10:1176–1196. - PMC - PubMed
    1. Andersen RA, Buneo CA. Intentional maps in posterior parietal cortex. Ann Rev Neurosci. 2002;25:189–220. - PubMed
    1. Andersen RA, Cui H. Intention, action planning, and decision making in parietal-frontal circuits. Neuron. 2009;63:568–583. - PubMed
    1. Andersen RA, Essick GK, Siegel RM. Encoding of spatial location by posterior parietal neurons. Science. 1985;230:456–458. - PubMed
    1. Andersen RA, Mountcastle VB. The influence of the angle of gaze upon the excitability of the light-sensitive neurons of the posterior parietal cortex. J Neurosci. 1983;3:532–548. - PMC - PubMed

Publication types

LinkOut - more resources