. 2012 Oct 1;370(1):42-51.
doi: 10.1016/j.ydbio.2012.07.021. Epub 2012 Jul 27.

Activation of germline-specific genes is required for limb regeneration in the Mexican axolotl

Affiliations

Activation of germline-specific genes is required for limb regeneration in the Mexican axolotl

Wei Zhu et al. Dev Biol. .

Abstract

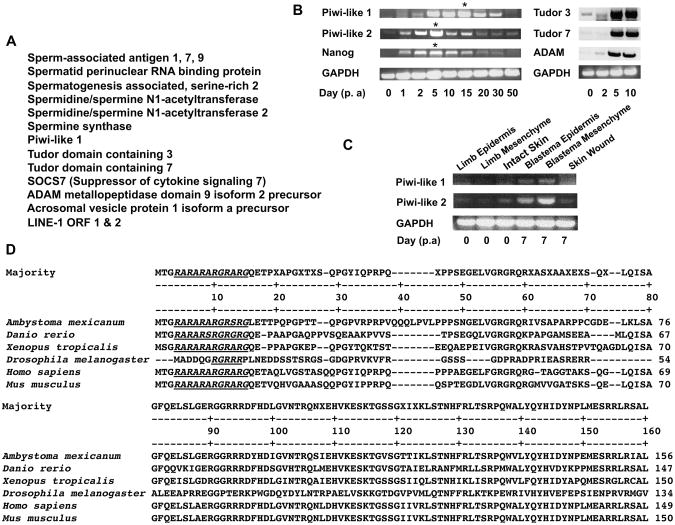
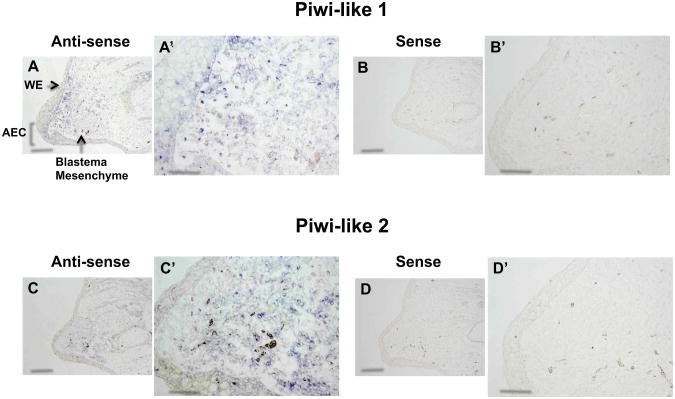
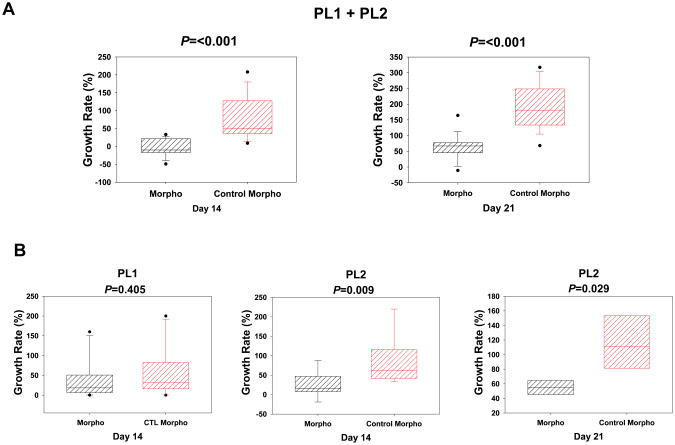
The capacity for tissue and organ regeneration in humans is dwarfed by comparison to that of salamanders. Emerging evidence suggests that mechanisms learned from the early phase of salamander limb regeneration-wound healing, cellular dedifferentiation and blastemal formation-will reveal therapeutic approaches for tissue regeneration in humans. Here we describe a unique transcriptional fingerprint of regenerating limb tissue in the Mexican axolotl (Ambystoma mexicanum) that is indicative of cellular reprogramming of differentiated cells to a germline-like state. Two genes that are required for self-renewal of germ cells in mice and flies, Piwi-like 1 (PL1) and Piwi-like 2 (PL2), are expressed in limb blastemal cells, the basal layer keratinocytes and the thickened apical epithelial cap in the wound epidermis in the regenerating limb. Depletion of PL1 and PL2 by morpholino oligonucleotides decreased cell proliferation and increased cell death in the blastema leading to a significant retardation of regeneration. Examination of key molecules that are known to be required for limb development or regeneration further revealed that FGF8 is transcriptionally downregulated in the presence of the morpholino oligos, indicating PL1 and PL2 might participate in FGF signaling during limb regeneration. Given the requirement for FGF signaling in limb development and regeneration, the results suggest that PL1 and PL2 function to establish a unique germline-like state that is associated with successful regeneration.


Figures

Figure 1
Figure 1
Piwi-like 1 and 2 are specifically upregulated upon axolotl limb regeneration. A) Listed here are the germline-specific genes found to be expressed in regenerating axolotl limbs upon limb amputation using Roche 454 cDNA sequencing. B) RT-PCR time-course. Examination of the transcriptional activities of some of the indicated germline-specific genes during the process of axolotl limb regeneration. GAPDH was used as a control. The transcriptional activity peaks of PL1, PL2 and Nanog were labeled with asterisks. C) RT-PCR analysis of PL1 and PL2 transcriptional activity in the intact limb epidermis or mesenchyme, and in a healing superficial limb skin wound and regenerating limb blastemal epidermis and mesenchyme. D) Alignment of the N-terminal sequence of PL1 protein from several organisms, demonstrating that the arginine/alanine-rich motif (italic and underlined), a potential target for regulatory methylation, is evolutionarily conserved.
Figure 2
Figure 2
In situ hybridization of axolotl PL1 and PL2 in regenerating axolotl forelimb blastemas at an early-to-medium stage. For both PL1 and PL2 anti-sense probes, the positive signal (blue) was spread through the entire region of blastema mesenchyme and was also present in the basal layer of the wound epidermis (WE) and the thickened apical epithelial cap (APC). Images A′, B′, C and D′ are higher magnification views of the corresponding images in A, B, C and D. Scale bar in images A-D is 500 μm, and for images A′-D′, 200 μm.
Figure 3
Figure 3
Comparison of the regeneration progress in the right and left regenerating forelimbs from the same animal, with one transfected with mixed PL1 and PL2 MOs on day 5 pa and the other transfected with the mixed control MOs. Green fluorescence images demonstrate transfection efficiency in the limb regenerates. The blue arrows indicate the amputation planes and the red arrows indicate the tip of the limb regenerates. A microcaliper was used to measure the length of the blastema (from the amputation plane to the tip of the blastema) with the 0 mm line precisely marking the amputation plane. The 0 mm lines in the images were further strengthened in deep blue color. The microcaliper was placed perpendicularly to the blastemal AP axis. Deep blue dots were added along the outlines of regenerating limbs to make the regenerating limbs more visible. Scale bars = 1 mm.
Figure 4
Figure 4
Effect of PL1 and PL2 knockdown mediated by morpholino oligos (MO) on axolotl limb regeneration. A) Evaluation of limb blastema growth rate by PL1 and PL2 MO transfection in limb regenerates. Length of limb blastemas was measured at day 14 and day 21 after the first transfection to determine whether there was a differential pace of limb regeneration in the presence of PL1 and PL2 MOs. Results are compiled from 4 different experiments. Total 17 animals were used. P values are presented in the graph (PL1 and PL2 MOs, n=17; control MOs, n=17). B) Effect of PL1 or PL2 individual knockdown in the growth rate of limb blastemas. The result for day 14 was obtained from 2 different experiments. In total 10 (for PL1) or 9 (for PL2) animals were used. The result for PL2 on day 21 was obtained from one experiment in which 4 animals were used. Pvalues are presented in the graphs (PL1 and PL2 MO and control MO, n=10; PL2 day 14, MO and control MO, n=9; PL2 day 21, MO and control MO, n=4).
Figure 5
Figure 5
Transfection of PL1 and PL2 MOs in the regenerating forelimb blastemas affects cell proliferation and cell death. MO transfection was performed at 7 days pa with PL1/2 MOs injected in one forelimb of an animal and the control MOs in the other forelimb of the same animal, respectively. Limb regenerate tissues were collected another 7 days after MO transfection. To provide a baseline control, total RNA extracted from limb tissues harvested on day 0 during limb amputation were also subjected to RT qPCR. A) Examination of proliferation by detection of EdU incorporated into genomic DNA. B) TUNEL staining of limb blastemas. Scale bars= 200 μm. C, D) Statistical analysis of the effect of PL1 and PL2 knockdown on cell proliferation and cell death during limb regeneration. The percentage of proliferating cells was determined by the ratio of EdU-labeled cells in the population of DAPI-stained cells. We counted the absolute numbers of dead cells stained in red in the TUNEL assay to assess cell death rate. Error bars indicate the mean ±SD, n=7-8 per group. (n=7-8 refers to tissue section slides, and the tissue sections were derived from 3 animals). E) Axolotl PL1 and PL2 MO transfection led to decreased expression of FGF8 in the regenerating axolotl limb blastema. MOs were injected into one of the regenerating forelimb blastemas (5 dpa) while the control MOs were injected into the other forelimb blastema of the same animal. Seven days after transfection, limb blastemas were collected and total RNA was extracted for RT-PCR analysis. The tissue sections used for the quantitation analysis shown in panels C and D, and for the images shown in panels A and B were obtained from two separate experiments.
Figure 5
Figure 5
Transfection of PL1 and PL2 MOs in the regenerating forelimb blastemas affects cell proliferation and cell death. MO transfection was performed at 7 days pa with PL1/2 MOs injected in one forelimb of an animal and the control MOs in the other forelimb of the same animal, respectively. Limb regenerate tissues were collected another 7 days after MO transfection. To provide a baseline control, total RNA extracted from limb tissues harvested on day 0 during limb amputation were also subjected to RT qPCR. A) Examination of proliferation by detection of EdU incorporated into genomic DNA. B) TUNEL staining of limb blastemas. Scale bars= 200 μm. C, D) Statistical analysis of the effect of PL1 and PL2 knockdown on cell proliferation and cell death during limb regeneration. The percentage of proliferating cells was determined by the ratio of EdU-labeled cells in the population of DAPI-stained cells. We counted the absolute numbers of dead cells stained in red in the TUNEL assay to assess cell death rate. Error bars indicate the mean ±SD, n=7-8 per group. (n=7-8 refers to tissue section slides, and the tissue sections were derived from 3 animals). E) Axolotl PL1 and PL2 MO transfection led to decreased expression of FGF8 in the regenerating axolotl limb blastema. MOs were injected into one of the regenerating forelimb blastemas (5 dpa) while the control MOs were injected into the other forelimb blastema of the same animal. Seven days after transfection, limb blastemas were collected and total RNA was extracted for RT-PCR analysis. The tissue sections used for the quantitation analysis shown in panels C and D, and for the images shown in panels A and B were obtained from two separate experiments.

Similar articles

Cited by

References

    1. Bilican B, Fiore-Heriche C, Compston A, Allen ND, Chandran S. Induction of Olig2 precursors by FGF involves BMP signalling blockade at the Smad level. PLoS One. 2008;3:e2863. - PMC - PubMed
    1. Brockes JP, Kumar A. Appendage regeneration in adult vertebrates and implications for regenerative medicine. Science. 2005;310:1919–1923. - PubMed
    1. Carmell MA, Girard A, van de Kant HJ, Bourc'his D, Bestor TH, de Rooij DG, Hannon GJ. MIWI2 is essential for spermatogenesis and repression of transposons in the mouse male germline. Dev Cell. 2007;12:503–14. - PubMed
    1. Chen Y, Yang Z, Meng M, Zhao Y, Dong N, Yan H, Liu L, Ding M, Peng HB, Shao F. Cullin mediates degradation of RhoA through evolutionarily conserved BTB adaptors to control actin cytoskeleton structure and cell movement. Mol Cell. 2009;35:841–55. - PubMed
    1. Christensen RN, Weinstein M, Tassava RA. Fibroblast growth factors in regenerating limbs of Ambystoma: cloning and semi-quantitative RT-PCR expression studies. J Exp Zool. 2001;290:529–40. - PubMed

Publication types

MeSH terms