. 2012 Oct 1;370(1):52-62.
doi: 10.1016/j.ydbio.2012.07.019. Epub 2012 Jul 26.

Regional cell shape changes control form and function of Kupffer's vesicle in the zebrafish embryo

Affiliations

Regional cell shape changes control form and function of Kupffer's vesicle in the zebrafish embryo

Guangliang Wang et al. Dev Biol. .

Abstract

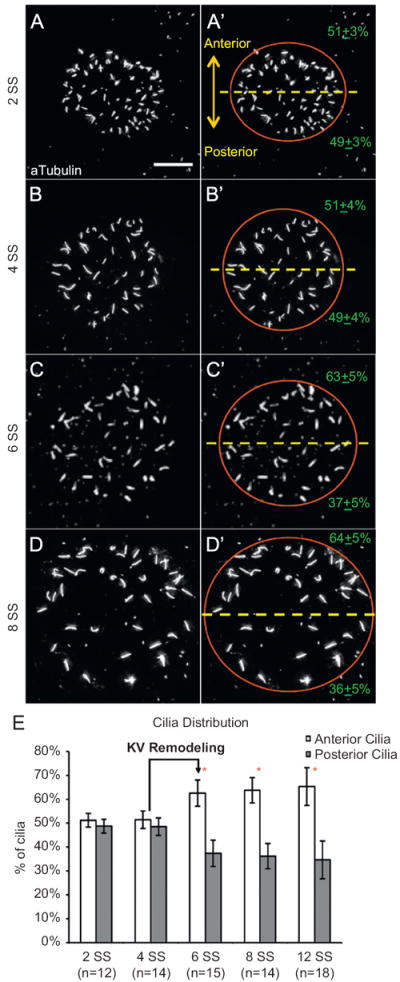
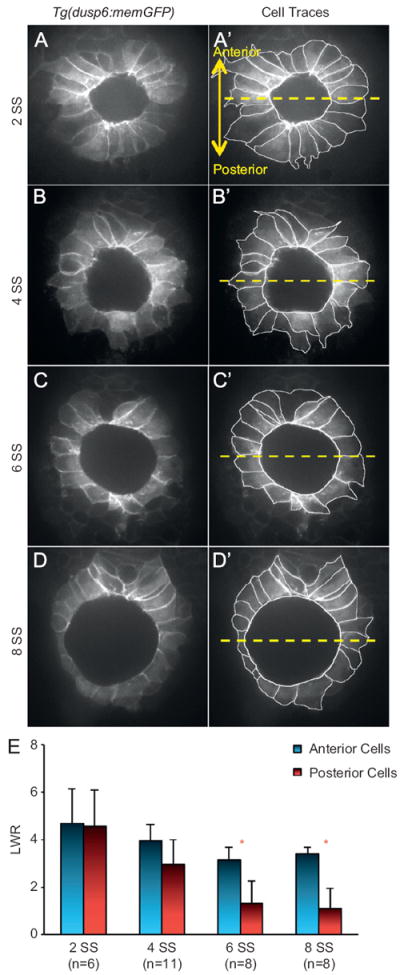
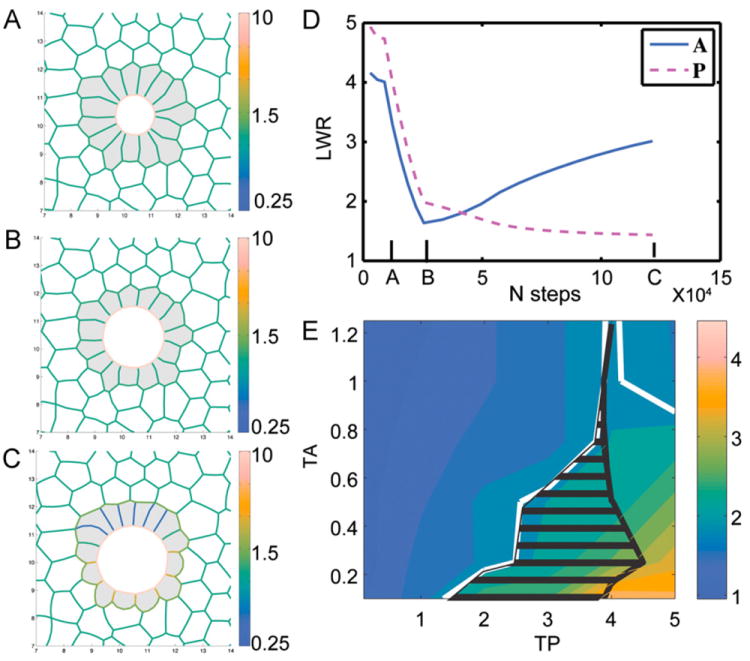
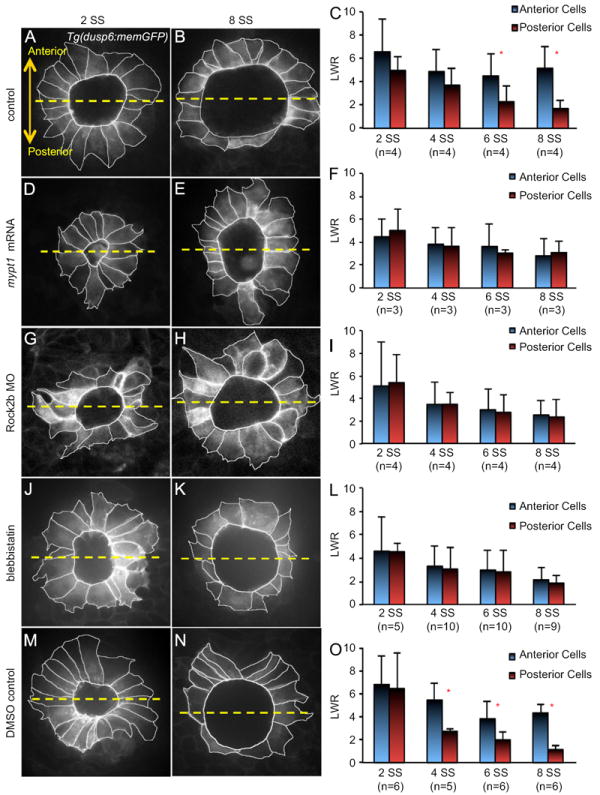
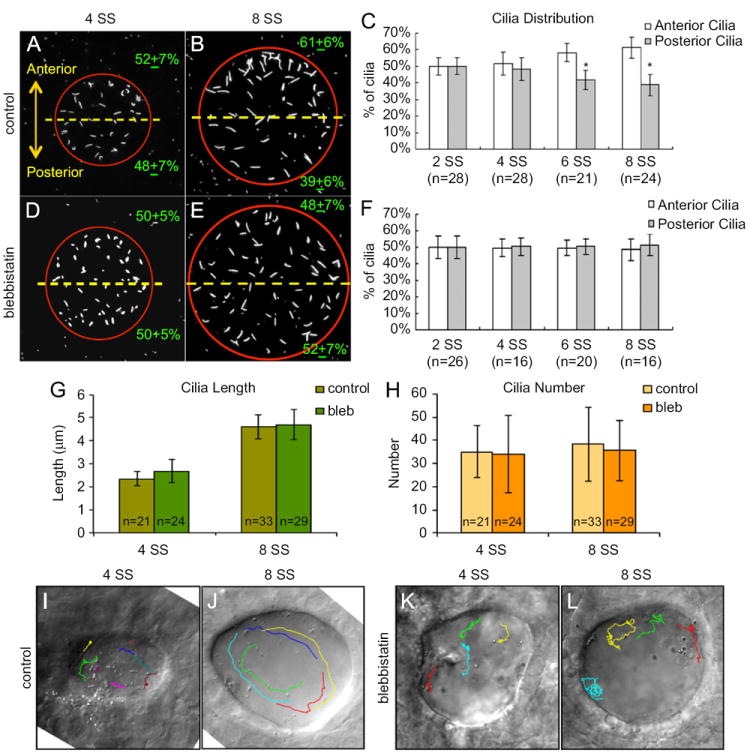
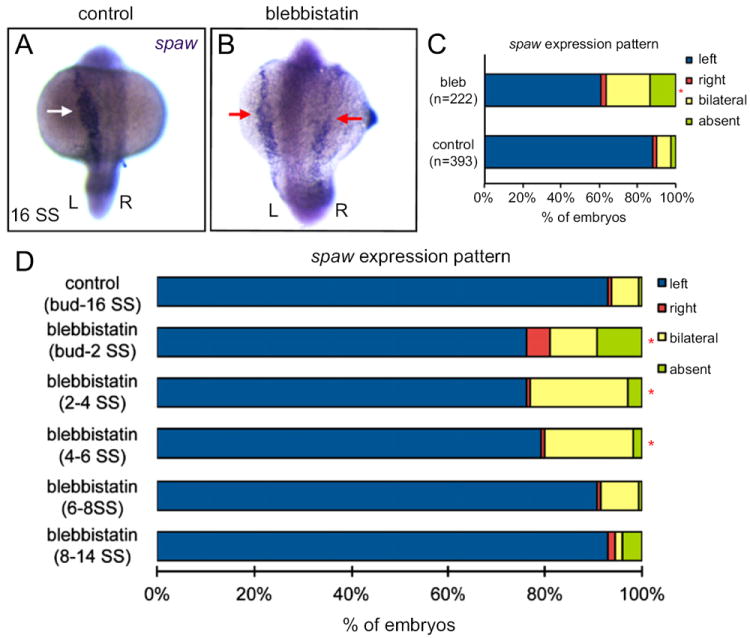
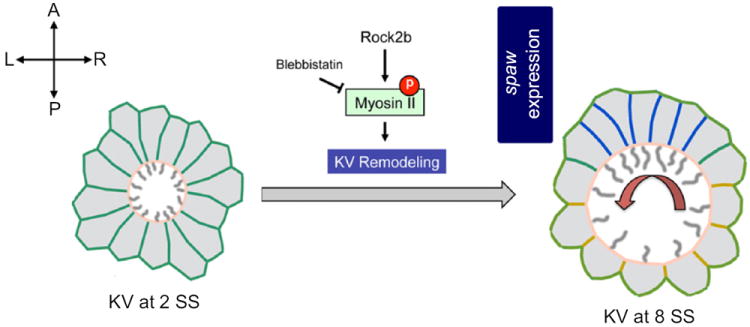
Cilia-generated fluid flow in an 'organ of asymmetry' is critical for establishing the left-right body axis in several vertebrate embryos. However, the cell biology underlying how motile cilia produce coordinated flow and asymmetric signals is not well defined. In the zebrafish organ of asymmetry-called Kupffer's vesicle (KV)-ciliated cells are asymmetrically positioned along the anterior-posterior axis such that more cilia are placed in the anterior region. We previously demonstrated that Rho kinase 2b (Rock2b) is required for anteroposterior asymmetry and fluid flow in KV, but it remained unclear how the distribution of ciliated cells becomes asymmetric during KV development. Here, we identify a morphogenetic process we refer to as 'KV remodeling' that transforms initial symmetry in KV architecture into anteroposterior asymmetry. Live imaging of KV cells revealed region-specific cell shape changes that mediate tight packing of ciliated cells into the anterior pole. Mathematical modeling indicated that different interfacial tensions in anterior and posterior KV cells are involved in KV remodeling. Interfering with non-muscle myosin II (referred to as Myosin II) activity, which modulates cellular interfacial tensions and is regulated by Rock proteins, disrupted KV cell shape changes and the anteroposterior distribution of KV cilia. Similar defects were observed in Rock2b depleted embryos. Furthermore, inhibiting Myosin II at specific stages of KV development perturbed asymmetric flow and left-right asymmetry. These results indicate that regional cell shape changes control the development of anteroposterior asymmetry in KV, which is necessary to generate coordinated asymmetric fluid flow and left-right patterning of the embryo.


Figures

Fig. 1
Fig. 1
Distribution of motile cilia becomes asymmetric along the anterior–posterior (AP) axis during Kupffer’s vesicle development. (A–D) Immunostaining of cilia in Kupffer’s vesicle (KV) with acetylated Tubulin antibodies at different somite stages (SS). (A′–D′) Red circle approximates the KV lumen boundary. The dashed yellow line bisects KV into anterior and posterior regions. All images are oriented with anterior at the top and posterior at the bottom. KV cilia were equally distributed between the anterior and posterior regions at 2 SS (A, A′) and 4 SS (B, B′). In contrast, However at 6 SS (C, C′) and 8 SS (D, D′), cilia were asymmetrically distributed. The average cilia distribution is presented±one standard deviation (in green). Scale bar=10 μm. (E) The percentage of cilia in anterior and posterior regions of KV at different stages of development. Error bars=one standard deviation. n=number of embryos analyzed. *Significant difference between anterior and posterior (p<0.0001).
Fig. 2
Fig. 2
Ciliated KV cells undergo region-specific cell shape changes during morphogenesis. (A–D) Optical cross-sections through the middle focal plane of KV cells expressing membrane-localized GFP in wild-type Tg(dusp6:memGFP) embryos at different stages of development. (A′–D′) KV cell boundaries were outlined to highlight cell shapes. The dashed yellow line bisects KV into anterior and posterior regions. All images are oriented with anterior at the top and posterior at the bottom. (E) Length-to-width ratio (LWR) of anterior and posterior cells at different stages of development. Error bars=one standard deviation. n=number of embryos analyzed. * Significant difference between anterior and posterior (p<0.01).
Fig. 3
Fig. 3
Mechanical model of KV remodeling. (A–C) Snapshots from a simulation of KV development (see Movie S2). KV cells are shaded gray and the color range indicates magnitude of interfacial tension between KV cells. (A) Initial mechanically stable structure, (B) stable structure with equal tension everywhere, area of lumen increased by factor of 3, and area of KV cells decreased by 25%, (C) stable structure with TA=0.25 and TP=3. For these parameters, final cell shapes and LWRs were very similar to those seen in normal KV development at 8 SS. (D) Evolution of average anterior LWR (blue) and posterior LWR (magenta) with the number of simulation steps. (E) Phase diagram of final anterior LWR/posterior LWR as a function of model parameters TA and TP. Solid white line indicates a contour at 2 (ratios above 2 are consistent with experimental observations) and black hatch marks indicate the region where cell shapes also match experimental observations (see Supplemental Text and Fig. S6).
Fig. 4
Fig. 4
Interfering with Myosin II Activity via Mypt1 over-expression, Rock2b knockdown or blebbistatin treatment disrupts KV cell shape changes. (A, B, D, E, G, H, J, K, M and N) Images of outlined KV cells in Tg(dusp6:memGFP) embryos at 2 SS (A, D, G, J, and M) or 8 SS (B, E, H, K and N) treated with control MO (A and B), mypt1 mRNA (D and E) Rock2b MO (G and H), blebbistatin (J and K) or DMSO (M and N). The dashed yellow line bisects KV into anterior and posterior regions. Images are oriented with anterior at the top and posterior at the bottom. (C, F, I, L and O) Average length-to-width ratios (LWR) of anterior and posterior cells at different stages of KV morphogenesis in treated embryos. Error bars=one standard deviation. n=number of embryos analyzed. * Significant difference between anterior and posterior (p<0.01).
Fig. 5
Fig. 5
Blebbistatin disrupts asymmetric cilia distribution and directional fluid flow in KV. (A, B, D and E) Immnostaining of KV cilia in control DMSO treated (A and B) and blebbistatin treated (D and E) embryos at 4 SS and 8 SS. (C and F) Analysis of cilia distribution in DMSO control (C) and blebbistatin (F) treated embryos during KV development. Error bars=one standard deviation. n=number of embryos analyzed. *Significant difference between anterior and posterior (p<0.0001). (G and H) KV cilia length (G) and number (H) was similar in control and blebbistatin treated embryos at 4 SS and 8 SS. Error bars=one standard deviation. n=number of embryos analyzed. (I–L) Visualization of fluid flow by superimposing tracks of bead movement on an image of KV (see Movies S4-S7). Control DMSO treated embryos displayed uncoordinated flow at 4 SS (I), but strong counter-clockwise flow at 8 SS (J). In blebbistatin treated embryos, directional flow was not observed at 4 SS (K) or 8 SS (L).
Fig. 6
Fig. 6
Blebbistatin treatment during early KV development stages disrupts LR patterning. (A and B) RNA in situ hybridizations show normal left-sided spaw expression (arrows) at 16 SS in a control embryo treated with DMSO (A) and bilaterally symmetric spaw expression in a blebbistatin treated embryo (B). (C) spaw expression was significantly altered in embryos treated with blebbistatin between 1–8 SS relative to DMSO controls. (D) Anlaysis of spaw expression in DMSO controls and embryos treated with blebbistatin during the stages indicated. n>100 embryos for all treatments. *Significantly different from controls (p<0.05).
Fig. 7
Fig. 7
A working model for the regulation of cell shape changes during KV morphogenesis. We propose KV remodeling is an important step of KV development mediated by cell shape changes that are critical for positioning more motile cilia (gray lines) in the anterior region of the organ to drive leftward fluid flow (red arrow) across the anterior pole and trigger left-sided spaw expression in lateral plate mesoderm. Mechanical modeling predicts AP asymmetry in interfacial tension between KV cells (blue represents lower tension and yellow represents higher tension) is involved in these cell shape changes. Experimental evidence suggests Myosin II activity—a regulator of interfacial tension—is activated via phosphorylation (P) by Rock2b to control KV remodeling.

Similar articles

Cited by

References

    1. Amack JD, Wang X, Yost HJ. Two T-box genes play independent and cooperative roles to regulate morphogenesis of ciliated Kupffer’s vesicle in zebrafish. Dev Biol. 2007;310:196–210. - PubMed
    1. Antic D, Stubbs JL, Suyama K, Kintner C, Scott MP, Axelrod JD. Planar cell polarity enables posterior localization of nodal cilia and left-right axis determination during mouse and Xenopus embryogenesis. PLoS One. 2010;5:e8999. - PMC - PubMed
    1. Beysens DA, Forgacs G, Glazier JA. Cell sorting is analogous to phase ordering in fluids. PNAS. 2000;97:9467–9471. - PMC - PubMed
    1. Borovina A, Superina S, Voskas D, Ciruna B. Vangl2 directs the posterior tilting and asymmetric localization of motile primary cilia. Nat Cell Biol. 2010;12:407–412. - PubMed
    1. Brakke K. The surface evolver. Exp Math. 1992;1:141–165.

Publication types

LinkOut - more resources