. 2012 Oct 5;422(5):617-634.
doi: 10.1016/j.jmb.2012.07.010. Epub 2012 Jul 24.

Gating movement of acetylcholine receptor caught by plunge-freezing

Affiliations

Gating movement of acetylcholine receptor caught by plunge-freezing

Nigel Unwin et al. J Mol Biol. .

Abstract

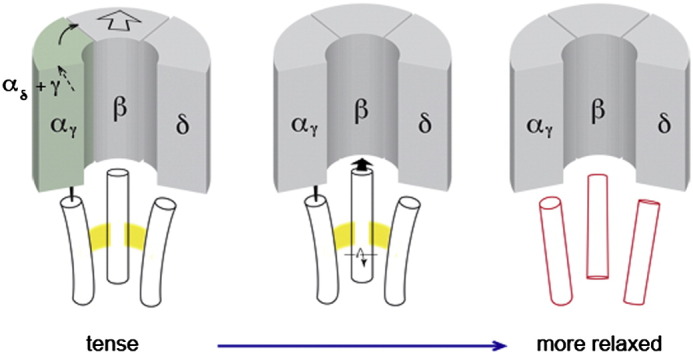
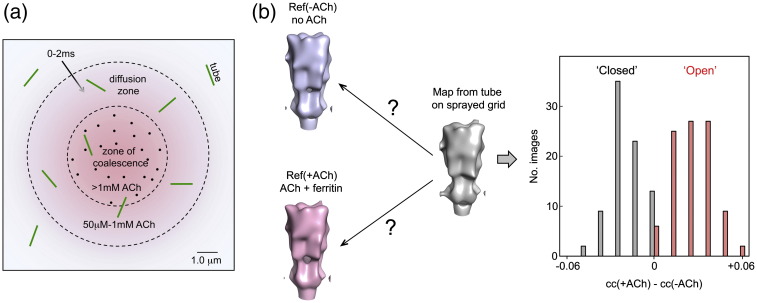
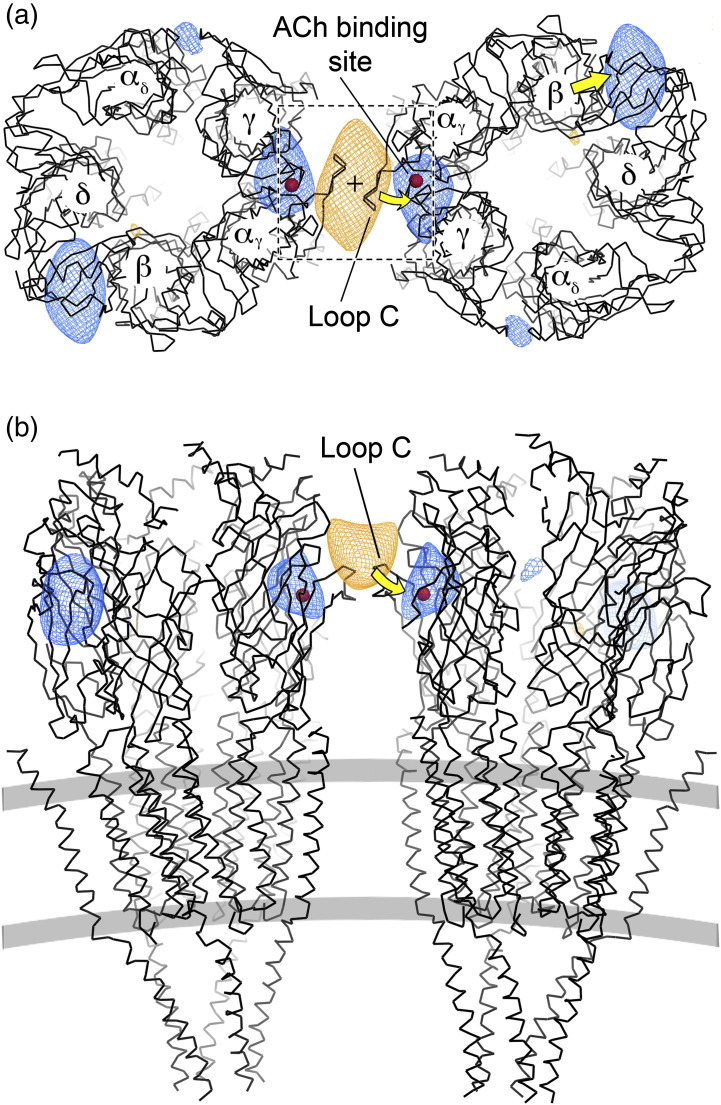
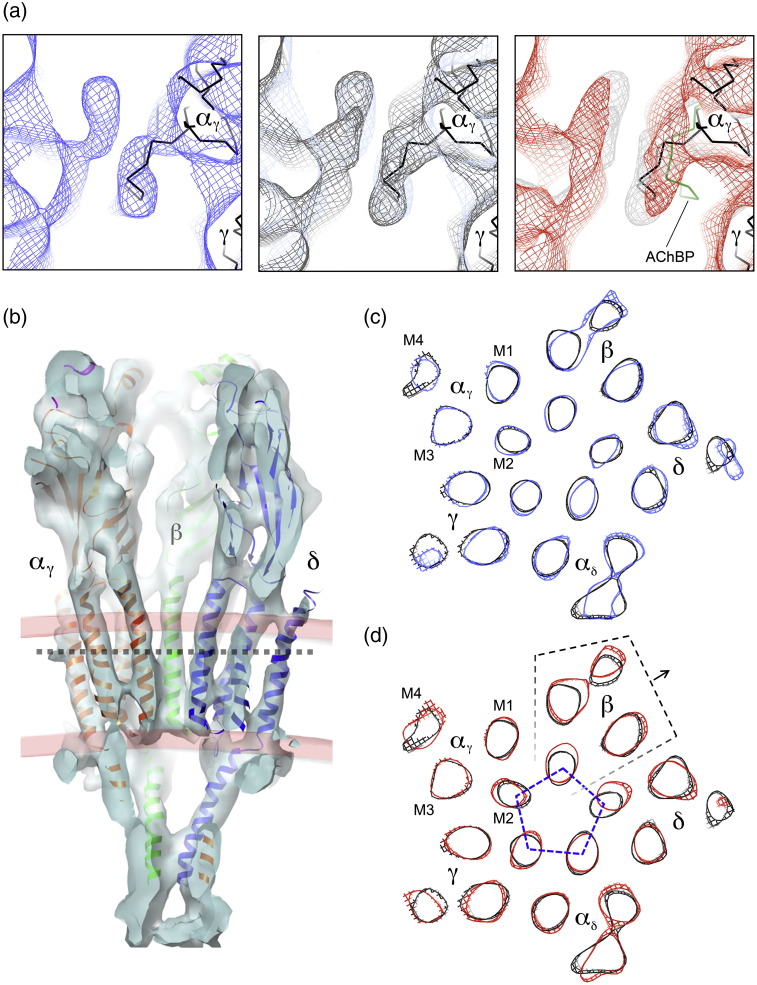
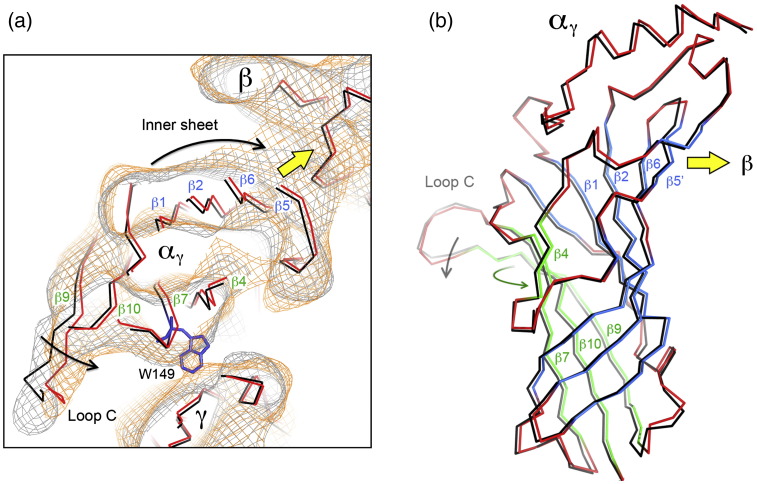
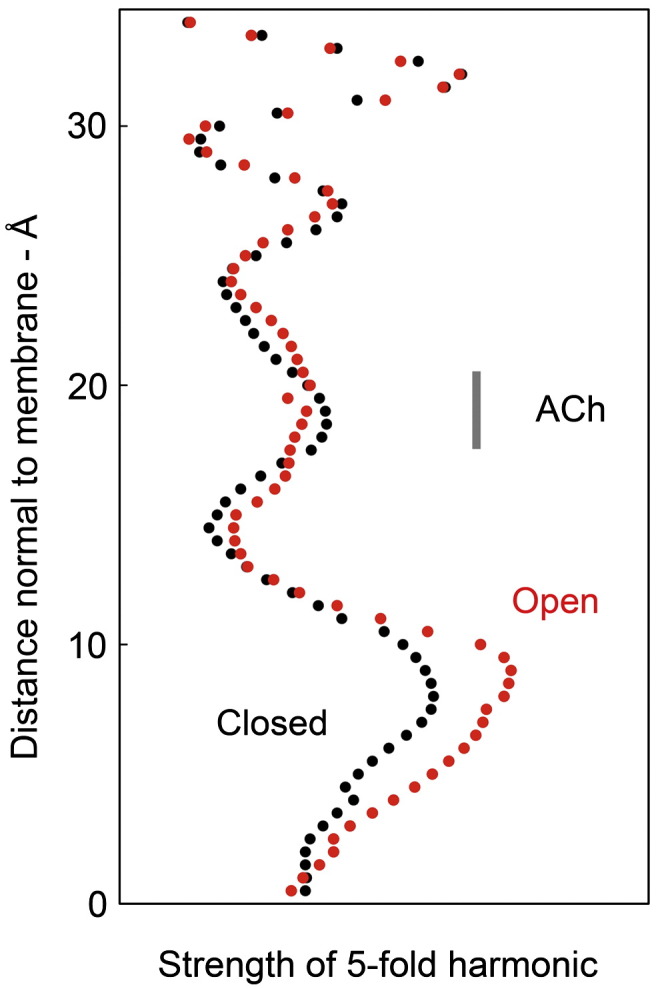
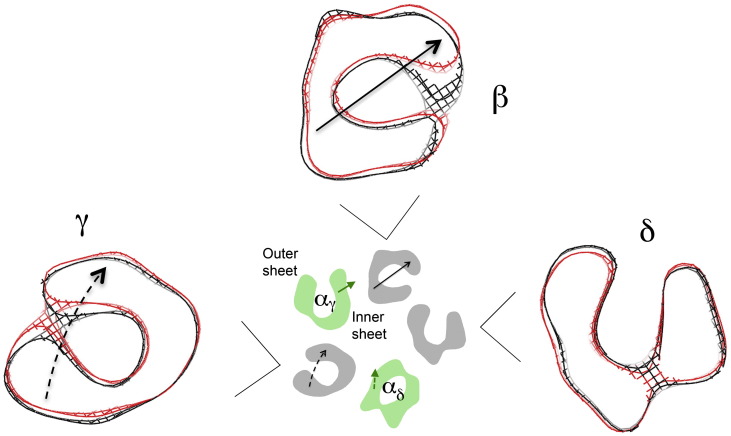
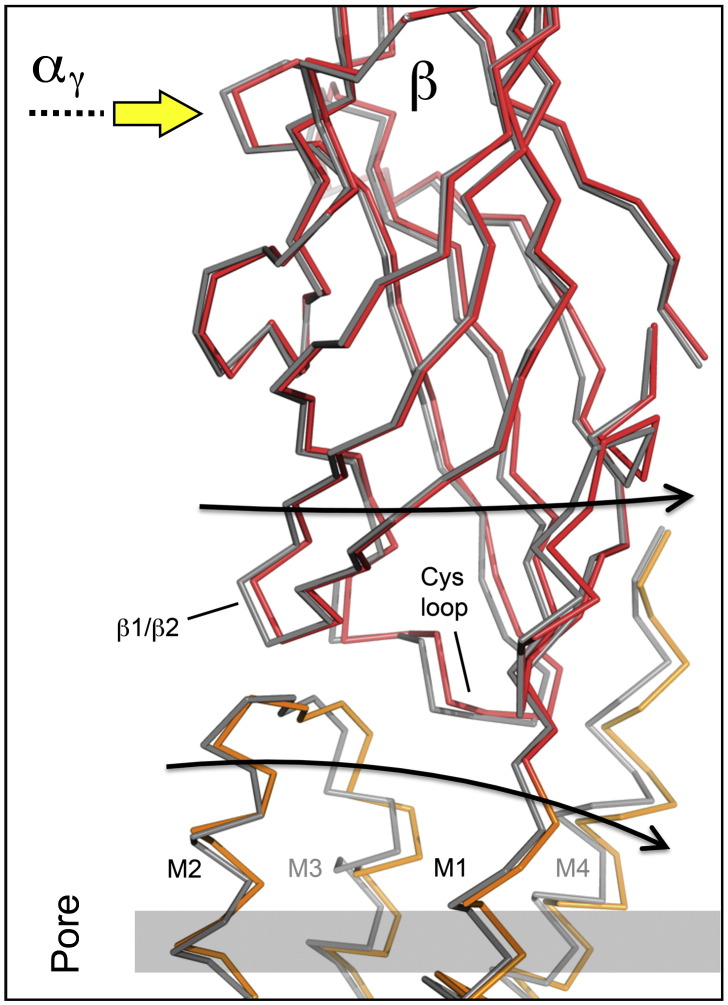
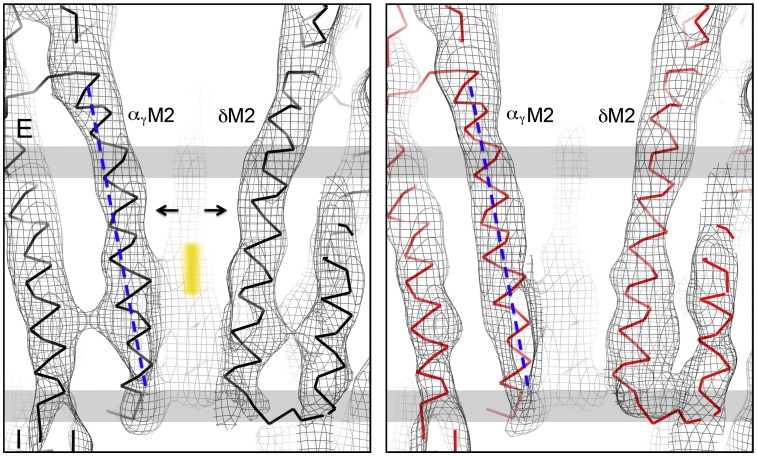
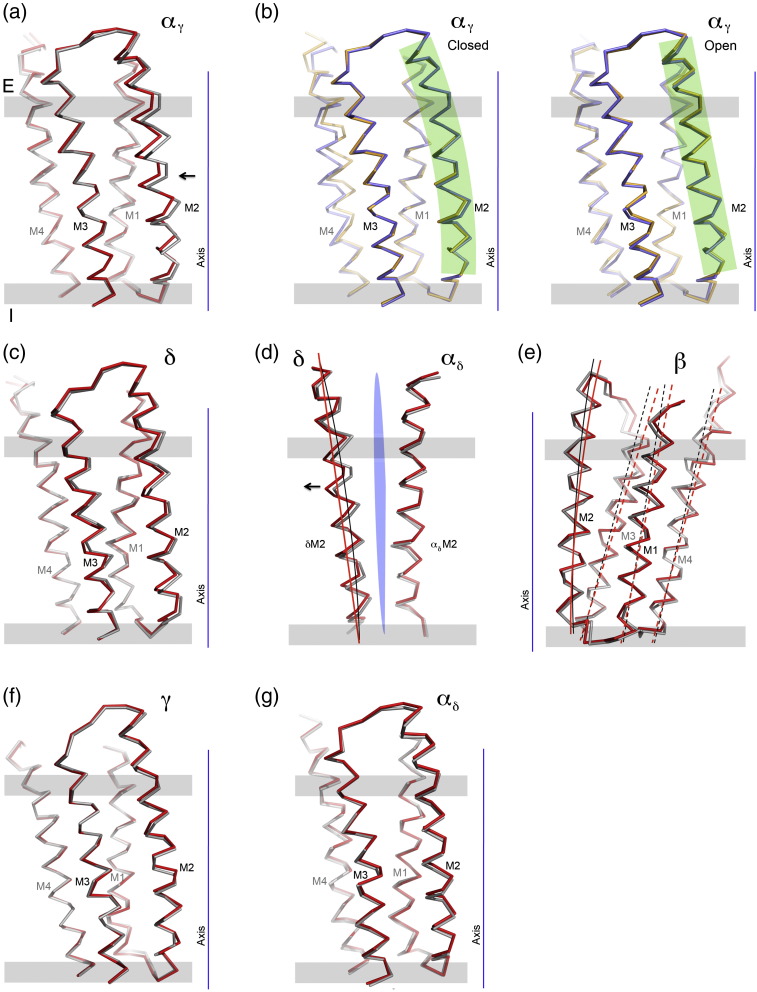
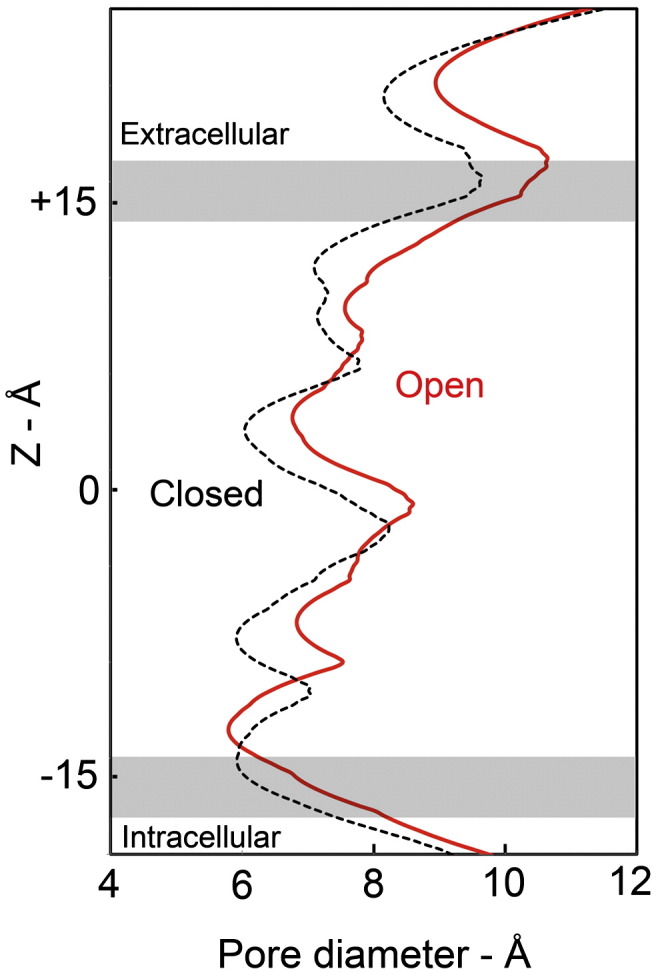
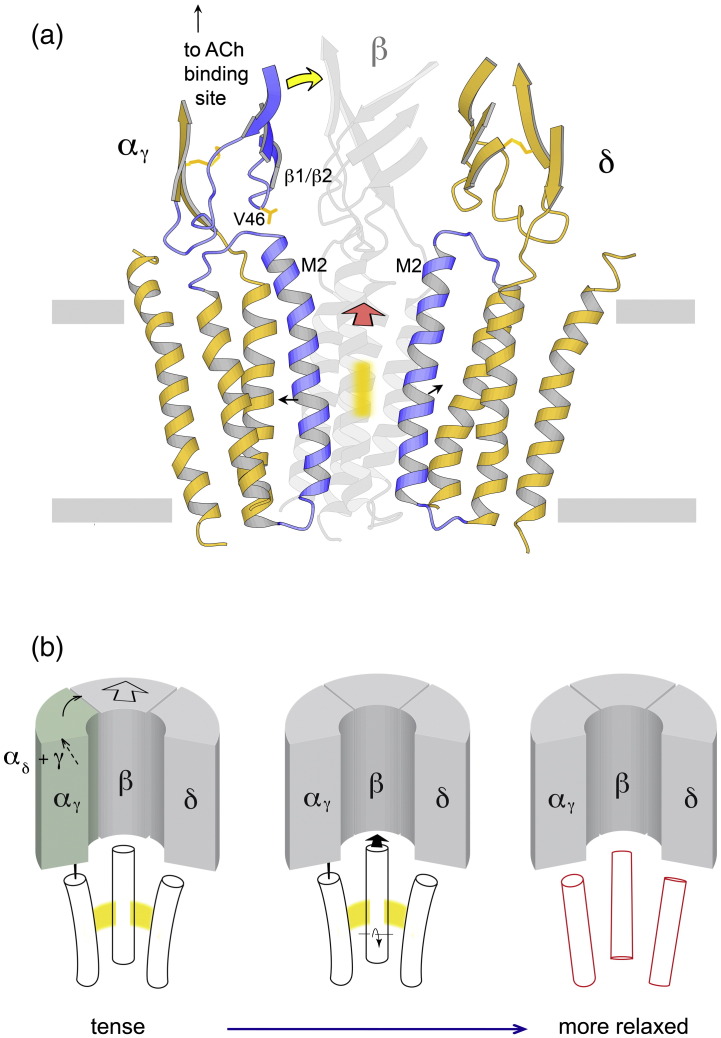
The nicotinic acetylcholine (ACh) receptor converts transiently to an open-channel form when activated by ACh released into the synaptic cleft. We describe here the conformational change underlying this event, determined by electron microscopy of ACh-sprayed and freeze-trapped postsynaptic membranes. ACh binding to the α subunits triggers a concerted rearrangement in the ligand-binding domain, involving an ~1-Å outward displacement of the extracellular portion of the β subunit where it interacts with the juxtaposed ends of α-helices shaping the narrow membrane-spanning pore. The β-subunit helices tilt outward to accommodate this displacement, destabilising the arrangement of pore-lining helices, which in the closed channel bend inward symmetrically to form a central hydrophobic gate. Straightening and tangential motion of the pore-lining helices effect channel opening by widening the pore asymmetrically and increasing its polarity in the region of the gate. The pore-lining helices of the α(γ) and δ subunits, by flexing between alternative bent and straight conformations, undergo the greatest movements. This coupled allosteric transition shifts the structure from a tense (closed) state toward a more relaxed (open) state.


Figures

None
Graphical abstract
Fig. 1
Fig. 1
ACh-spray activation and identification of tubes containing open channels. (a) Mixing of a 1‐μm‐diameter spray droplet, containing ACh and ferritin, with the grid-supported aqueous film 10 ms after impact: ACh (reddish colour) spreads beyond the ferritin (dots) within the zone of coalescence (inner dashed circle), reaching some tubes by diffusion; based on Ref. . (b) Sorting of ‘unlabelled’ tubes into closed and open classes by pairwise comparison of single-image density maps with reference maps, Ref(+ ACh) and Ref(− ACh), obtained from ACh-exposed ferritin-labelled tubes and from untreated tubes, respectively. The histogram plots the number of images against the difference between the two correlation coefficients (see Methods).
Fig. 2
Fig. 2
Reproducible structural changes induced by ACh activation. Regions of most significant difference between the closed- and open-class density maps are superimposed on a pair of neighbouring receptors (PDB ID: 2BG9) docked into the tube surface lattice. Views are (a) from the synaptic cleft and (b) parallel to the membrane (grey bars). The locations of individual polypeptide chains within each receptor are indicated. Dashed box in (a), area shown in Fig. 3a; central cross, radial 2-fold axis; red spheres, ACh binding site in αγ. Contours at P = 0.001: orange indicates decrease and blue indicates increase in density on exposure to ACh; yellow arrows indicate the nature of the structural displacements giving rise to the probability peaks.
Fig. 3
Fig. 3
Loop-C conformation and pore sizes of closed- and open-class structures. (a) Boxed area in Fig. 2 showing densities from the three ~ 6‐Å maps (blue, untreated tubes; grey, closed class; red, open class), and superimposed Cα backbones from the atomic model (black, PDB ID: 2BG9) and (right) loop C from aligned AChBP (green; PDB ID: 1I9B). (b) Central slab through ACh receptor, showing densities from the closed-class structure, and superimposed Cα backbone from the atomic model (ribbon representation; α, β, γ and δ in red, green, magenta and blue, respectively). The phospholipid headgroup regions (pink contours) are identified by two prominent bands of density running concentrically about the axis of the tube; their locations coincide with rings of negatively charged amino acids that affect conductance through the open pore. (c and d) Comparison of closed- and open-channel densities from the three ~ 6‐Å maps in a cross section through the extracellular leaflet of the lipid bilayer [level of dashed bar in (b)]; colours as in (a). The broken lines in (d) highlight the pentagonally symmetric arrangement of M2 helices around the pore of the closed channel and the movement outwards of all four helices of β when the channel opens. The mesh interval corresponds to 1 Å; all contours at 1 σ.
Fig. 4
Fig. 4
ACh binding to αγ triggers a rearrangement of its inner and outer β‐sheets. (a) Slab through the closed- and open-class density maps at the level of the ACh binding site (grey contours, closed; orange contours, open), and the superimposed fitted Cα backbones (black, closed; red, open). The location of W149, a key ACh-binding residue, is also shown. Contours at 1 σ. (b). Whole extracellular portion of the αγ subunit viewed from the lumen of the channel. The superimposed Cα backbones are coloured as in (a), but with the inner and outer sheets of the open channel coloured blue and green, respectively. Arrows in (a) and (b) denote ACh-induced displacements (see the text).
Fig. 5
Fig. 5
Variations in 5-fold strength at different levels through the ligand-binding domain. Power spectra were calculated from 1‐Å-spaced sections through the two density maps, and the relative strength of the 5-fold harmonic at successive sections through the structure is plotted (closed class, black; open class, red). The open channel displays stronger 5-fold symmetry, especially in the lower portion where the inner and outer β-sheets are most extensive and pack against each other. The location of ACh (based on the aligned structure of AChBP with bound carbamylcholine18) is indicated.
Fig. 6
Fig. 6
ACh-induced displacements of the non-α subunits at the base of the ligand-binding domain. Superimposed cross sections through the core β-sheet densities of β, γ and δ are shown, enlarged relative to the central pentamer, with arrows to indicate the displacements of β and γ. As indicated on the pentamer, these displacements, and those of the α inner sheets (green), all point in roughly the same direction (see also Fig. S6). Black and red are for the closed- and open-class maps; contours at 1.3 σ. ACh-induced displacements of the non-α subunits at the base of the ligand-binding domain. Superimposed cross sections through the core β-sheet densities of β, γ and δ are shown, enlarged relative to the central pentamer, with arrows to indicate the displacements of β and γ. As indicated on the pentamer, these displacements, and those of the α inner sheets (green), all point in roughly the same direction (see also Fig. S6). Black and red are for the closed- and open-class maps; contours at 1.3 σ.
Fig. 7
Fig. 7
The outward displacement of β is transmitted to the membrane. Superposition of the fitted Cα backbones (closed channel, grey; open channel, red or orange) shows that the displacement of β, driven by αγ (yellow arrow), involves tilting of the extracellular and membrane portions (curved arrows) about their shared the interface, located ~ 10 Å above the membrane surface (grey bar). Both parts move as rigid bodies (see also Figs. 6 and 9e and Supplementary Movie 1). The outward displacement of β is transmitted to the membrane. Superposition of the fitted Cα backbones (closed channel, grey; open channel, red or orange) shows that the displacement of β, driven by αγ (yellow arrow), involves tilting of the extracellular and membrane portions (curved arrows) about their shared the interface, located ~ 10 Å above the membrane surface (grey bar). Both parts move as rigid bodies (see also Figs. 6 and 9e and Supplementary Movie 1).
Fig. 8
Fig. 8
Flexure of pore-lining helices contributes to widening of the pore. Shown are closed- and open-channel densities (left and right panels, respectively), with superimposed Cα backbones, in a near-axial slab containing αγM2 and δM2. These helices increase the dimensions of the pore by straightening (arrows) in response to ACh binding, as indicated for αγM2 by comparison with the overlaid broken line. The straightening of δM2 is less obvious in this figure because it is predominantly tangential to the axis of the pore (see Fig. 9d). Vertical orange bar identifies the assumed location of gate. Membrane, grey bars; E, extracellular; I, intracellular. Contours at 1 σ.
Fig. 9
Fig. 9
The principal gating movements are mediated by the membrane helices of αγ, δ and β. (a) Superposition of the Cα backbones of the αγ helices in the closed (grey) and open (red) channel structures, showing that αγM2 straightens when the channel opens. (b) Superposition of αγM2 helices (orange and blue traces) in the closed (left) and open (right) class, determined from independent half data sets; green shading highlights the alternative curved and straight conformations of αγM2. (c) Superposition of the δ helices in closed- and open-channel structures. Flexure of M2 in the δ subunit is accompanied by a similar (but lesser) flexure of M3, whereas the other helices (M1 and M4) do not change appreciably. (d) Crevice (blue wedge) exposed between δM2 and αδM2 by straightening of δM2, as indicated by a pair of overlaid lines (viewed from inside the pore; see also Fig. S7). (e) Tilting of membrane helices in the β subunit. All fourhelices of β tilt by ~ 2° to open the channel, as indicated by the pairs of overlaid lines. (f and g) Superposition of membrane helices in γ and αδ: the helices in these subunits have nearly identical closed and open conformations (see also Fig. S8). The closed-channel (grey) and open-channel (red) colour scheme is used throughout; arrows indicate directions of main displacements. Membrane, grey bars; E, extracellular; I, intracellular. The principal gating movements are mediated by the membrane helices of αγ, δ and β. (a) Superposition of the Cα backbones of the αγ helices in the closed (grey) and open (red) channel structures, showing that αγM2 straightens when the channel opens. (b) Superposition of αγM2 helices (orange and blue traces) in the closed (left) and open (right) class, determined from independent half data sets; green shading highlights the alternative curved and straight conformations of αγM2. (c) Superposition of the δ helices in closed- and open-channel structures. Flexure of M2 in the δ subunit is accompanied by a similar (but lesser) flexure of M3, whereas the other helices (M1 and M4) do not change appreciably. (d) Crevice (blue wedge) exposed between δM2 and αδM2 by straightening of δM2, as indicated by a pair of overlaid lines (viewed from inside the pore; see also Fig. S7). (e) Tilting of membrane helices in the β subunit. All four helices of β tilt by ~ 2° to open the channel, as indicated by the pairs of overlaid lines. (f and g) Superposition of membrane helices in γ and αδ: the helices in these subunits have nearly identical closed and open conformations (see also Fig. S8). The closed-channel (grey) and open-channel (red) colour scheme is used throughout; arrows indicate directions of main displacements. Membrane, grey bars; E, extracellular; I, intracellular.
Fig. 10
Fig. 10
ACh-induced change to the limiting diameter of the pore, calculated with the program HOLE, after fitting the coordinates of the atomic model (PDB ID: 2BG9) to the closed- and open-class density maps (black and red curves, respectively). The diameter of the pore increases in the constricting hydrophobic region near the middle of the membrane (at Z = 0), and the narrowest part shifts to the intracellular membrane surface where the pore is lined by polar residues. (The constricting hydrophobic region can be identified with the bulge on δM2 at the level of the orange bar in Fig. 8).
Fig. 11
Fig. 11
Structural mechanism of gating. (a) Proposed principal gating action: binding of ACh induces displacement of the inner β-sheet of αγ (yellow arrow), which pushes out β (red arrow); this destabilises the helical arrangement forming a central hydrophobic gate (orange bar), releasing the bent αγM2 and δΜ2 helices (short arrows) that can now straighten, opening up the pore. Ribbon diagram is for the closed channel. Main moving parts of αγ and δ in blue. (b) Overall allosteric model: ACh binding relieves ‘distortions’ in the α subunits, causing displacements that combine (thin arrows, left) to push the extracellular part of β outward (thick arrow, left). The outward movement of β propagates into the membrane (arrows, middle), breaking symmetrical interactions between pore-lining helices (yellow), allowing them to adopt an alternative ‘freed’ configuration (right) that is permeable to ions.

References

    1. Lester H.A., Dibas M.I., Dahan D.S., Leite J.F., Dougherty D.A. Cys-loop receptors: new twists and turns. Trends Neurosci. 2004;27:329–336. - PubMed
    1. Sine S.M., Engel A.G. Recent advances in Cys-loop receptor structure and function. Nature. 2006;440:448–455. - PubMed
    1. Thompson A.J., Lester H.A., Lummis S.C.R. The structural basis of function in Cys-loop receptors. Q. Rev. Biophys. 2011;43:449–499. - PubMed
    1. Miyazawa A., Fujiyoshi Y., Unwin N. Structure and gating mechanism of the acetylcholine receptor pore. Nature. 2003;423:949–955. - PubMed
    1. Unwin N. Refined structure of the nicotinic acetylcholine receptor at 4 Å resolution. J. Mol. Biol. 2005;346:967–989. - PubMed

Publication types

LinkOut - more resources