. 2012 Dec;39(4):398-411.
doi: 10.1016/j.jaut.2012.06.005. Epub 2012 Jul 28.

The constant region contributes to the antigenic specificity and renal pathogenicity of murine anti-DNA antibodies

Affiliations

The constant region contributes to the antigenic specificity and renal pathogenicity of murine anti-DNA antibodies

Yumin Xia et al. J Autoimmun. 2012 Dec.

Abstract

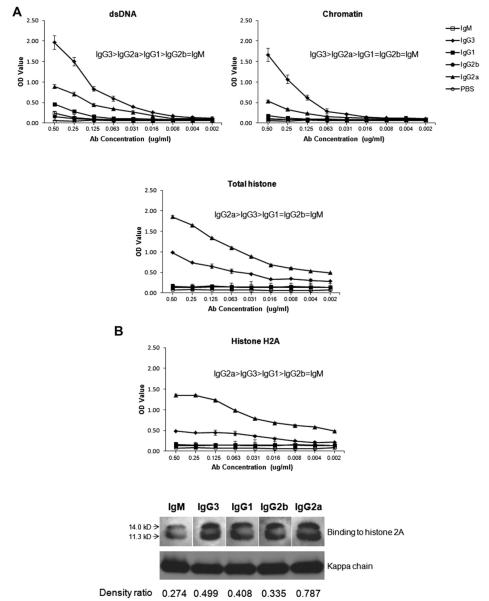
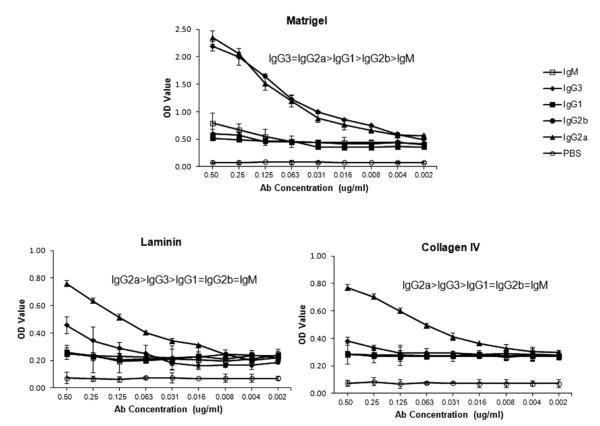
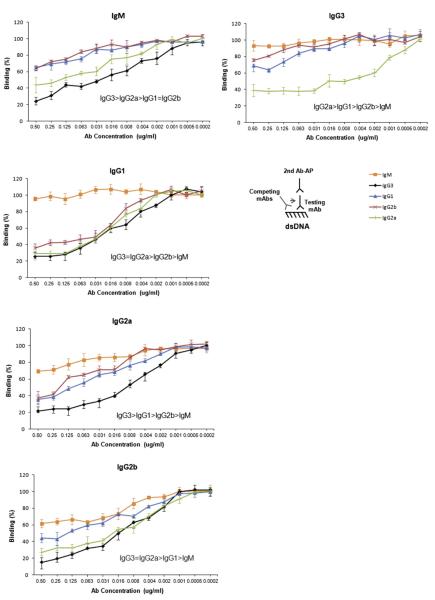
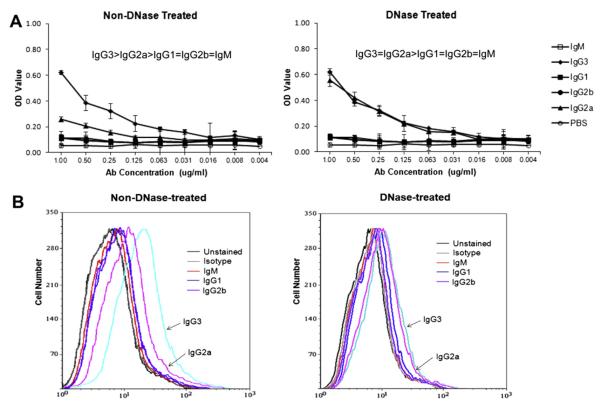
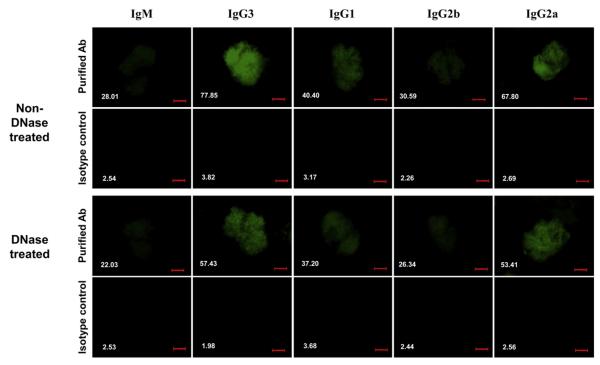
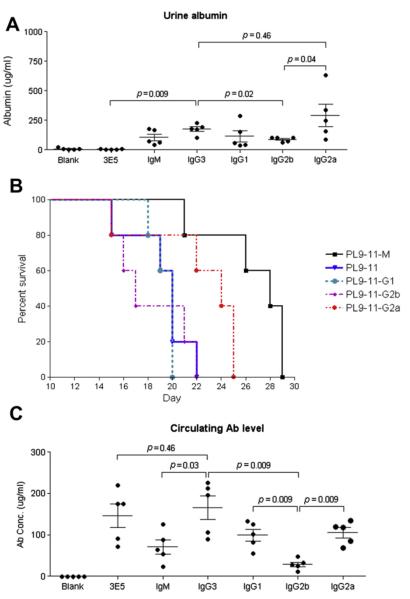
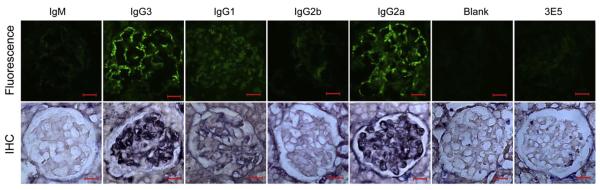
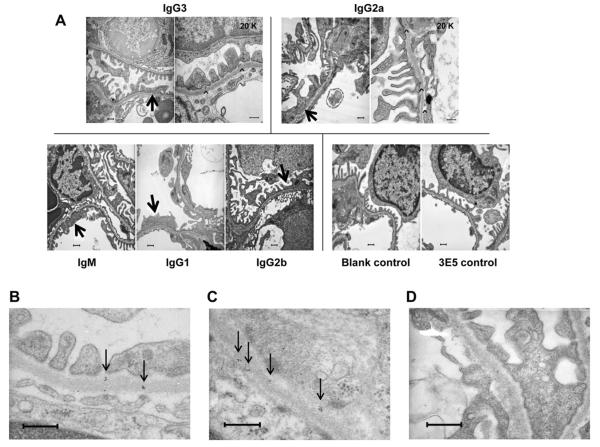
Affinity for DNA and cross-reactivity with renal antigens are associated with enhanced renal pathogenicity of lupus autoantibodies. In addition, certain IgG subclasses are enriched in nephritic kidneys, suggesting that isotype may determine the outcome of antibody binding to renal antigens. To investigate if the isotype of DNA antibodies affects renal pathogenicity by influencing antigen binding, we derived IgM, IgG1, IgG2b and IgG2a forms of the PL9-11 antibody (IgG3 anti-DNA) by in vitro class switching or PCR cloning. The affinity and specificity of PL9-11 antibodies for nuclear and renal antigens were analyzed using ELISA, Western blotting, surface plasmon resonance (SPR), binding to mesangial cells, and glomerular proteome arrays. Renal deposition and pathogenicity were assayed in mice injected with PL9-11 hybridomas. We found that PL9-11 and its isotype-switched variants had differential binding to DNA and chromatin (IgG3>IgG2a>IgG1>IgG2b>IgM) by direct and competition ELISA, and SPR. In contrast, in binding to laminin and collagen IV the IgG2a isotype actually had the highest affinity. Differences in affinity of PL9-11 antibodies for renal antigens were mirrored in analysis of specificity for glomeruli, and were associated with significant differences in renal pathogenicity in vivo and survival. Our novel findings indicate that the constant region plays an important role in the nephritogenicity of antibodies to DNA by affecting immunoglobulin affinity and specificity. Increased binding to multiple glomerular and/or nuclear antigens may contribute to the renal pathogenicity of anti-DNA antibodies of the IgG2a and IgG3 isotype. Finally, class switch recombination may be another mechanism by which B cell autoreactivity is generated.


Figures

Fig. 1
Fig. 1
Members of the PL9–11 antibody panel display variable affinity to nuclear antigens. (A) Serial dilutions of normalized mAbs were reacted with dsDNA, chromatin, and total histone bound to ELISA plates, and detected using an anti-kappa secondary antibody as described in Section 2. Data are representative of five experiments performed in duplicate. (B) mAb binding to purified histone H2A was assayed by ELISA and Western blot. For the Western blot, purified histone H2A was run by SDS–PAGE, and probed with isotype-specific anti-heavy chain antibodies and with an anti-kappa secondary antibody. The density ratios of the histone and kappa chain bands (as measured by ImageJ) for each isotype were calculated, and are provided at the bottom of the panel. ELISA data are representative of five experiments done in duplicate, and the Western blotting data is representative of two experiments.
Fig. 2
Fig. 2
Members of the PL9–11 antibody panel display variable affinity to glomerular antigens. Binding of PL9e11 and its class switch variants to representative glomerular antigens relevant to anti-DNA antibody binding to renal tissue, including Matrigel, laminin, and collagen IV, was assayed by serial dilutions on antigen precoated ELISA plates. Data are representative of five experiments performed in duplicate.
Fig. 3
Fig. 3
Competitive binding to dsDNA among the different PL9–11 mAbs. Serial dilutions of PL9–11 mAbs (“competing antibodies”) were bound to dsDNA coated ELISA plates, followed by each individual isotype (“test antibody”) at a fixed concentration of 0.5 μg/ml to assess the relative affinities of the test and competing antibodies to dsDNA. The title of each panel denotes the test antibody against which each of the other isotypes is competing for binding in that particular experiment. The amount of the test antibody that remained bound to dsDNA was detected with an isotype-specific secondary antibody, as shown in the illustration. Binding of the test antibody to dsDNA without the presence of a competitor was defined as 100%. Each dilution of the competing antibody was done in triplicate, and the mean and SD values are presented on the graph. Data are representative of three experiments performed in duplicate.
Fig. 4
Fig. 4
Binding of the PL9–11 antibody panel to MC. Primary MRL/lpr MC were grown in culture, and used to assess binding of the PL9–11 isotype variants, with and without DNAse treatment. (A) Binding to MC bound to ELISA plates, with or without cell DNAse pre-treatment. Data are representative of four experiments performed in duplicate. (B) Binding to MC by members of the PL9–11 antibody panel as assessed by flow cytometry, with or without cell DNAse pre-treatment. Data are representative of three experiments performed in triplicate.
Fig. 5
Fig. 5
Antibody binding to glomeruli ex vivo. Glass slides containing fixed mouse glomeruli were blocked with 2.5% goat serum and rat anti-mouse CD16/32 antibody, and incubated with purified Abs at a concentration of 0.5 μg/ml. Antibody binding was detected with a FITC-labeled IgG goat anti-mouse kappa chain. Slides were then washed, stained with DAPI solution, and viewed at room temperature with a Zeiss fluorescence microscope. The mean fluorescent intensities for the binding of each PL9–11 antibody and its corresponding isotype control were measured using ImageJ software, and are provided in white font in the lower left corner of each panel. For the experiment depicted in the bottom part of the figure, glomeruli were first DNAsed as described in the Materials and Methods, and the assay then continued as described. Data are representative of three experiments performed in duplicate (200× magnification, numerical aperture = 0.5, bar = 50 μm).
Fig. 6
Fig. 6
Renal disease and survival in SCID mice injected with PL9–11 hybridomas. Eight week old SCID mice received pristane 0.5 ml intraperitoneally, followed two weeks later by intraperitoneal injection of 107 hybridoma cells of each of the PL9–11 clones. Control groups of mice received pristane alone (“Blank”), or an IgG3-secreting hybridoma that does not bind DNA or glomerular antigens (3E5). (A) Ten days after the hybridoma cells were injected, urine albumin concentrations were determined. (B) Mice were sacrificed when they appeared moribund. Although there are no significant differences in the survival of mice injected with IgG3, IgG1, IgG2b, and IgG2a, the difference in survival between IgM and the IgG isotype injected mice groups is significant (p < 0.01). Note the overlap between the survival curves of IgG3 (in blue) and IgG1 (in green). (C) The concentration of the particular isotype each mouse group was injected with, in serum obtained at sacrifice, was measured by ELISA. For panels (A) and (C), mean and SEM are depicted.
Fig. 7
Fig. 7
Immunoglobulin deposition in SCID mice injected with PL9–11 hybridoma clones. Frozen and paraffin sections of kidneys from mice injected with PL9–11 hybridoma cell lines were obtained, and stained for isotype-specific deposition by immunofluorescence and immunohistochemistry, respectively. By immunofluorescence, all mice injected with the PL9–11 clones of the IgM and IgG2b isotypes were completely negative. PL9–11 IgG3 and IgG2a injected mice all showed segmental to global granular glomerular basement membrane and mesangial staining. Three out of the five PL9–11 IgG1 injected mice showed faint staining. Staining for immunoglobulin deposition by immunohistochemistry showed similar differences between the groups. Kidneys of mice injected with pristane alone (not followed by a PL9–11 panel hybridoma) or with the non-DNA binding 3E5 clone (IgG3) did not demonstrate glomerular immunoglobulin deposition by either method. A representative staining pattern is shown for each mouse group. Immunofluorescence and immunohistochemistry images are representative of two experiments performed in duplicate (200× magnification, numerical aperture = 0.5, bar = 20 μm).
Fig. 8
Fig. 8
Transmission electron microscopy and immunogold staining of glomeruli from SCID mice injected with PL9–11 hybridoma clones. (A) Kidneys of mice injected with pristane alone (not followed by a PL9–11 panel hybridoma; “blank control”) or with the non-DNA binding 3E5 clone (IgG3) demonstrated normal kidney morphology, with preserved podocyte foot processes and no deposits along the glomerular basement membrane (bottom right). In contrast, patchy effacement of podocyte foot processes was present in glomeruli of SCID mice injected with PL9–11 hybridomas (arrows). In addition, electron dense deposits (arrowheads) were seen in IgG3 and IgG2a injected mice. In PL9–11 IgG3 injected mice, deposits were most often seen in a subepithelial location (between the glomerular basement membrane and the podocytes). In glomeruli of IgG2a injected mice deposits were more common, and found in subepithelial, intra-membranous, and subendothelial locations. A representative image from 5 mice injected with each cell line is shown (10K magnification, except where indicated on the image). (B)–(D) Mice injected with the PL9–11 IgG3 hybridoma display kidney immunoglobulin deposition, as demonstrated by immunogold staining. Sections were stained with gold-labeled donkey anti-mouse IgG labeled at 4 °C overnight and postfixed in 2% glutaraldehyde in PBS, as described in Section 2. (B), (C) Immunogold staining shows scattered intra-membranous clusters of gold particles (black dots; arrows) within glomeruli of the PL9–11 IgG3 injected mice, consistent with early immune complex deposition (40K magnification). (D) Significant immunogold particle staining is not observed in a 3E5 (IgG3) injected mouse (40K magnification, bar = 500 nm). A representative image from five mice injected with each cell line is shown.

References

    1. Sherer Y, Gorstein A, Fritzler MJ, Shoenfeld Y. Autoantibody explosion in systemic lupus erythematosus: more than 100 different antibodies found in SLE patients. Sem Arthritis Rheum. 2004;34:501–37. - PubMed
    1. Jang EJ, Nahm DH, Jang YJ. Mouse monoclonal autoantibodies penetrate mouse macrophage cells and stimulate NF-kappaB activation and TNF-alpha release. Immunology Lett. 2009;124:70–6. - PubMed
    1. Qing X, Pitashny M, Thomas DB, Barrat FJ, Hogarth MP, Putterman C. Pathogenic anti-DNA antibodies modulate gene expression in mesangial cells: involvement of HMGB1 in anti-DNA antibody-induced renal injury. Immunology Lett. 2008;121:61–73. - PMC - PubMed
    1. Yung S, Tsang RC, Sun Y, Leung JK, Chan TM. Effect of human anti-DNA antibodies on proximal renal tubular epithelial cell cytokine expression: implications on tubulointerstitial inflammation in lupus nephritis. J Amer Soc Nephrol. 2005;16:3281–94. - PubMed
    1. Hahn BH. Antibodies to DNA. N Engl J Med. 1998;338:1359–68. - PubMed

Publication types

MeSH terms