. 2013 Feb;9(2):151-8.
doi: 10.1016/j.nano.2012.07.002. Epub 2012 Jul 25.

Nanoparticle uptake in tumors is mediated by the interplay of vascular and collagen density with interstitial pressure

Affiliations

Nanoparticle uptake in tumors is mediated by the interplay of vascular and collagen density with interstitial pressure

Sason Torosean et al. Nanomedicine. 2013 Feb.

Abstract

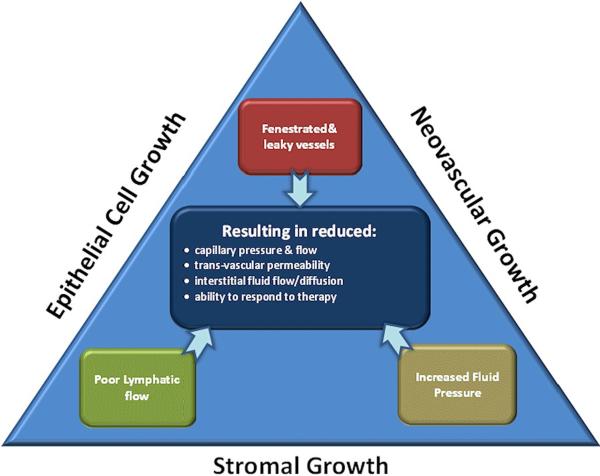
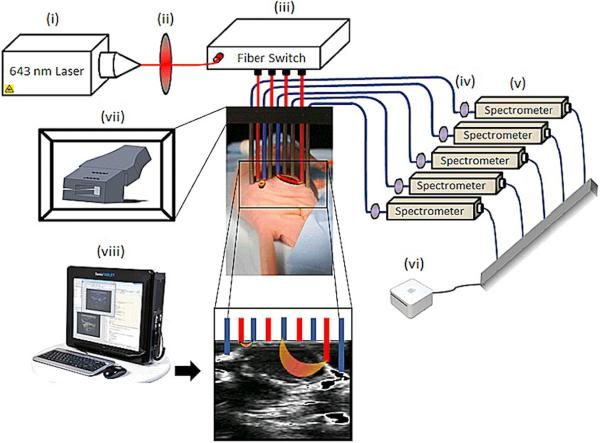
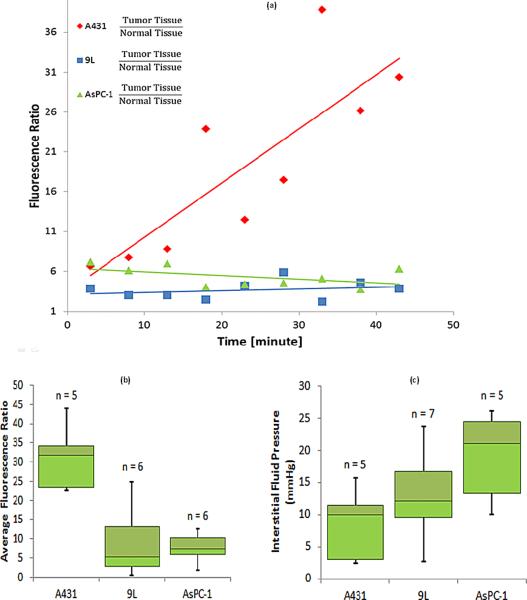
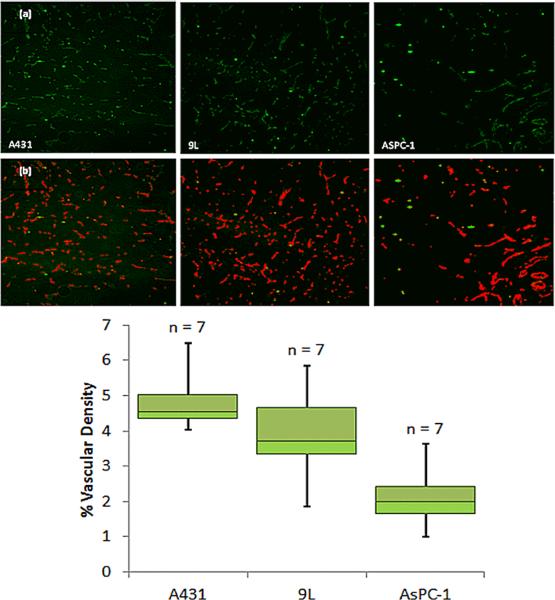
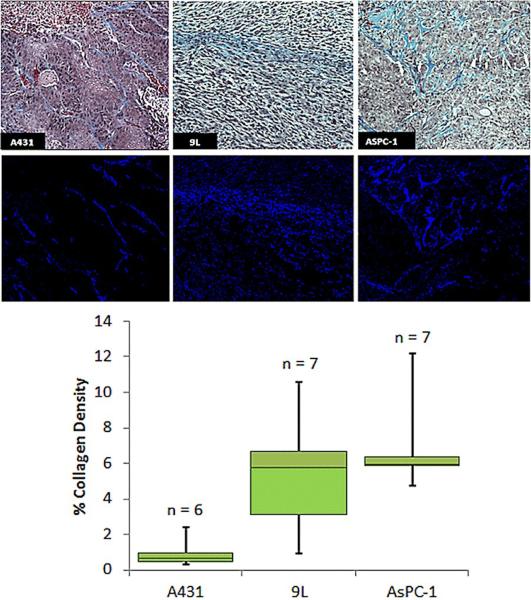
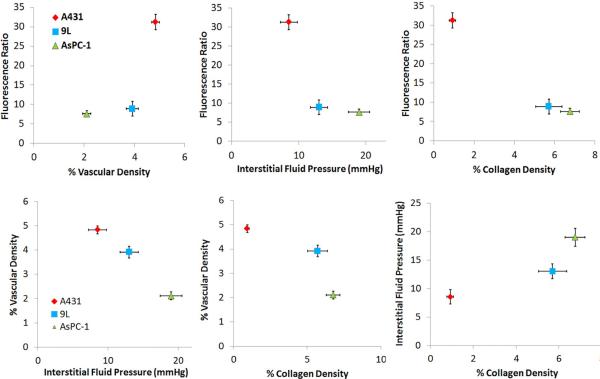
Nanoparticle delivery into solid tumors is affected by vessel density, interstitial fluid pressure (IFP) and collagen, as shown in this article by contrasting the in vivo macroscopic quantitative uptake of 40 nm fluorescent beads in three tumor types.The fluorescence uptake was quantified on individual animals by normalization with the transmitted light and then normalized to normal tissue uptake in each mouse. Mean data for uptake in individual tumor lines then showed expected trends with the largest uptake in the most vascularized tumor line. Tumor lines with increased collagen were also consistent with highest interstitial fluid pressure and correlated with lowest uptake of nanoparticles. The data is consistent with a delivery model indicating that while vascular permeability is maximized by neovascular growth, it is inhibited by collagen content and the resulting interstitial pressure. Imaging of these parameters in vivo can lead to better individual noninvasive methods to assess drug penetration in situ.

From the clinical editor: In this manuscript the dependence of nanoparticle delivery is addressed from the standpoint of vascular factors (the more vascularized, the better delivery) and as a function of collagen density and interstitial pressure (the higher these are, the worse the delivery).


Figures

Figure 1
Figure 1
Tumor transport dynamics are influenced by the physical growth of tumor epithelial cells, neovasculature and stroma in the tumor. These contribute to the internal effects of lymphatic flow constriction, leaky vessels and increased interstitial fluid pressure. These effects are all observed by imaging as reduction in capillary pressure, permeability, flow/diffusion into the tumor, and inability to respond to therapy.
Figure 2
Figure 2
Instrumentation: Schematics of an Ultrasound coupled FMT imaging setup. Light from a 643 nm laser diode (i) is routed through a short pass filter (ii) to a 1×4 fiber switch (iii) to illuminate the target sequentially in each of 4 possible locations. Emitted fluorescent light is subsequently routed through one or two (transmission mode or fluorescence mode) long pass filters (iv) to a separate spectrometer for each pick up fiber (v). The computer (vi) acquires and analyzes the data from spectrometers, removing background autofluorescence. Ultrasound (viii) is coupled to the optical probes via a fiber holder (vii) to localize the fiber positioning in this study.
Figure 3
Figure 3
Drug uptake is plotted for individual mice (a), using the median normalized fluorescence measurements with respect to healthy tissue. Average fluorescence ratio values are shown in (b) summarizing the temporal average presence of fluorescent nanoparticles in tumor lines. The interstitial fluid pressure measurements are summarized (c) for each tumor line. The number of animals is denoted above each bar.
Figure 4
Figure 4
Immunohistochemical images used to estimate vasculature area is shown in (a) with representative images of CD31 staining for each tumor line. In (b) the blood vessel density is calculated by thresholding raw data and dividing the number of pixels indicating vasculature (Red) by the total number of pixels. This results in (c) a summary of calculated percent vasculature area values for the three tumor lines. Again number of animals is reported above each bar.
Figure 5
Figure 5
Histochemical analyses of collagen area. (a) Representative images of Masson's Trichrome staining for each tumor line. Collagen Density is calculated by thresholdingof the data to binary images (b) and dividing the number of pixels indicating collagen (dark blue) by the total number of pixels in the image. A summary of the calculated percent collagen area is shown in (c).
Figure 6
Figure 6
Dependence of the fluorescence is plotted with respect to the analyzed pathophysiological parameters (a) vascular density, (b) interstitial pressure, and (c) collagen density. The data from each tumor type grouped as a single point with the standard error bars shown. Then in (d), (e) and (f) the three pathophysiological parameters are plotted against each other to show their interdependence. Table 2 shows a measure of the strength of this dependence, through the square of the Pearson's correlation coefficient.

References

    1. Giustini AJ, Ivkov R, Hoopes PJ. Magnetic nanoparticle biodistribution following intratumoral administration. Nanotechnology. 2011;22(34):345101. - PMC - PubMed
    1. I H, R H, R H. Thermal Ablation of Tumors Using Magnetic Nanoparticles An In Vivo Feasibility Study. Investigative Radiology. 2002;37:580–586. - PubMed
    1. Cho K, Wang X, Nie S, Cho K, Wang X, Nie S, Chen ZG, Shin DM. Therapeutic Nanoparticles for Drug Delivery in Cancer Therapeutic Nanoparticles for Drug Delivery in Cancer. Clinical Cancer Research. 2008:1310–1316. - PubMed
    1. Petros RA, Desimone JM. Strategies in the design of nanoparticles for therapeutic applications. Nature Reviews Drug Discovery. 2010;9(8):615–627. - PubMed
    1. Holback H, Yeo Y. Intratumoral drug delivery with nanoparticulatecarriers. Pharmaceutical research. 2011;28:1819–1830. - PMC - PubMed

Publication types

LinkOut - more resources