. 2012 Nov;8(11):4053-63.
doi: 10.1016/j.actbio.2012.07.024. Epub 2012 Jul 25.

Hydroxyapatite nanoparticle reinforced peptide amphiphile nanomatrix enhances the osteogenic differentiation of mesenchymal stem cells by compositional ratios

Affiliations

Hydroxyapatite nanoparticle reinforced peptide amphiphile nanomatrix enhances the osteogenic differentiation of mesenchymal stem cells by compositional ratios

Jeremy B Vines et al. Acta Biomater. 2012 Nov.

Abstract

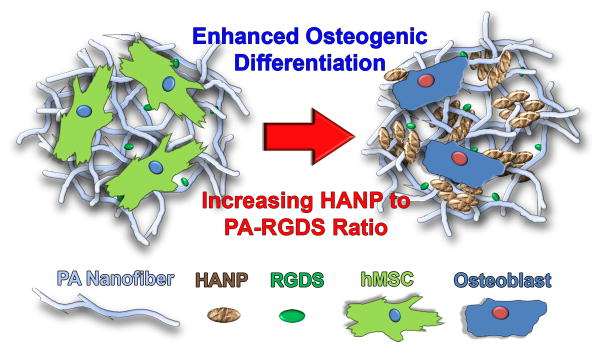
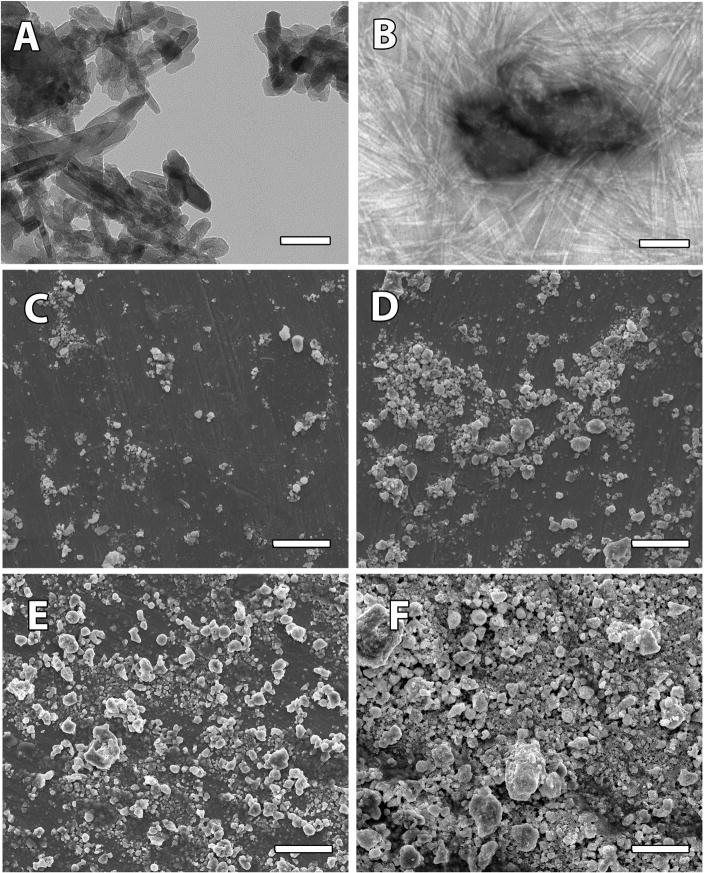
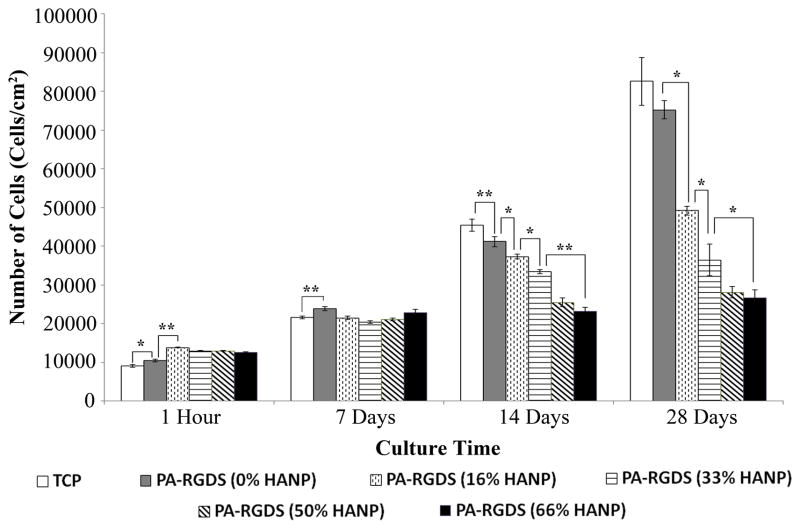
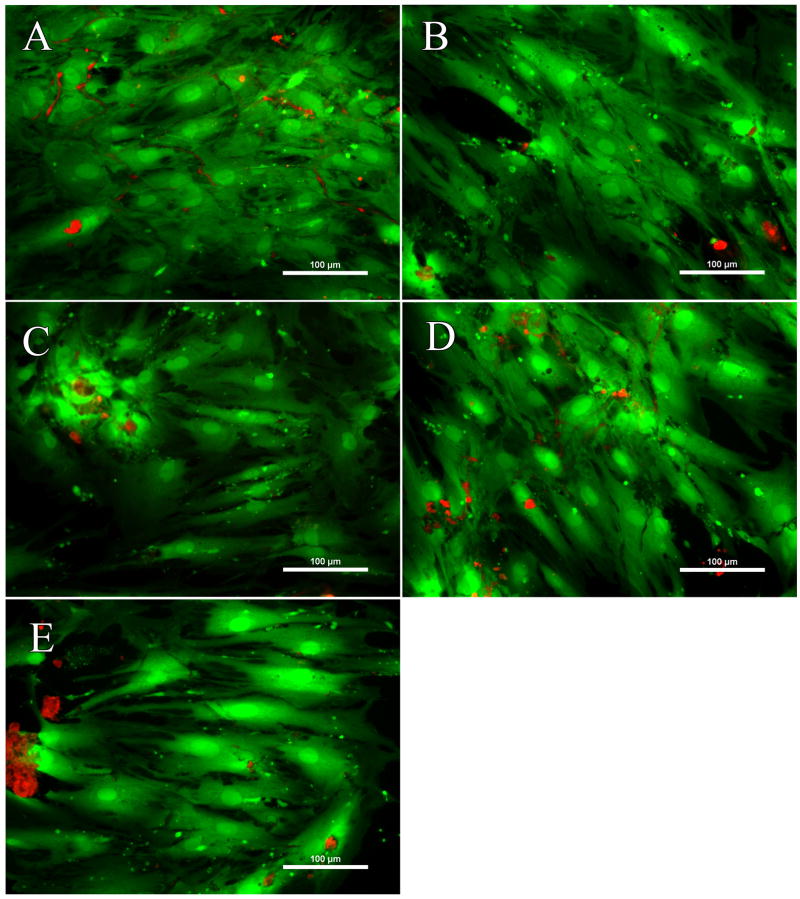
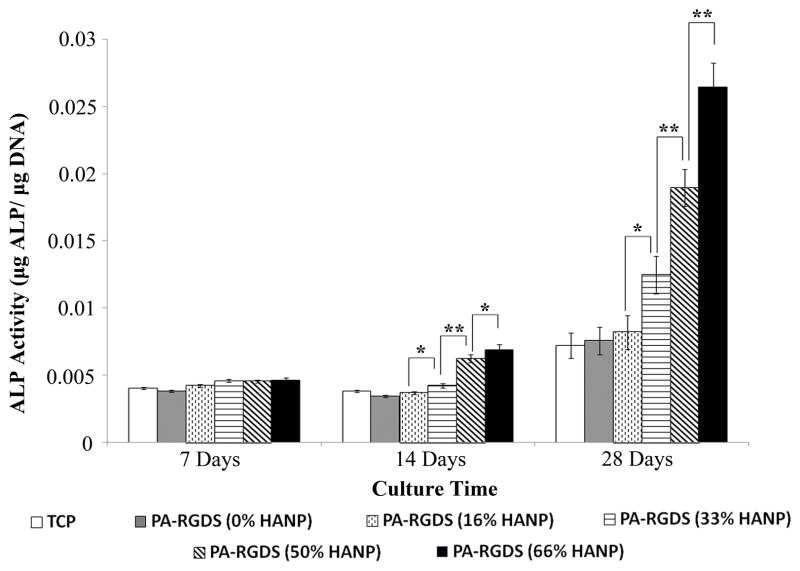
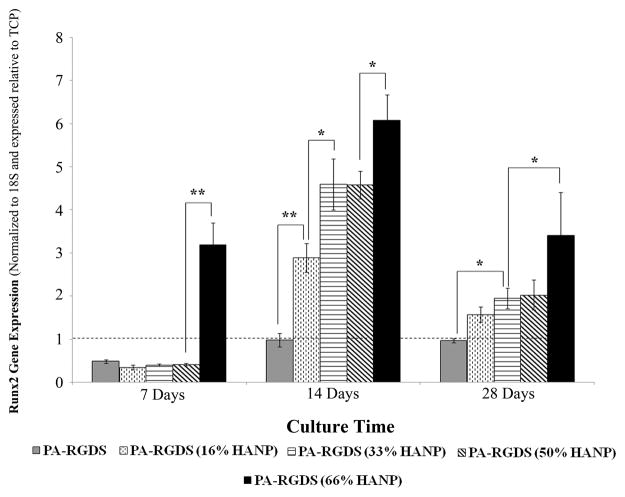
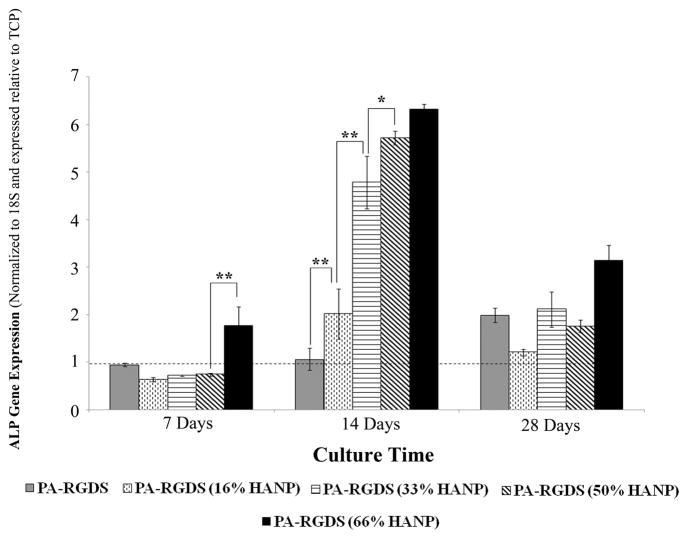
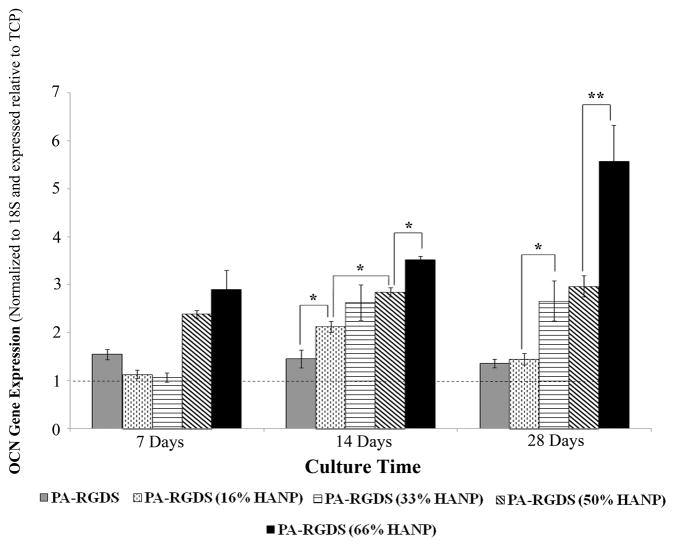
In the field of bone tissue engineering, there is a need for materials that mimic the native bone extracellular matrix (ECM). This need is met through the creation of biphasic composites intended to mimic both the organic and inorganic facets of the native bone ECM. However, few studies have created composites with organic ECM analogous components capable of directing cellular behaviors and many are not fabricated in the nanoscale. Furthermore, few attempts have been made at investigating how variations of organic and inorganic components affect the osteogenic differentiation of human mesenchymal stem cells (hMSCs). To address these issues, biphasic nanomatrix composites consisting of hydroxyapatite nanoparticles (HANPs) embedded within peptide amphiphile (PA) nanofibers tailored with the RGDS cellular adhesion motif (PA-RGDS) were created at various HANP to PA-RGDS ratios. Fabrication of these biphasic nanomatrix composites was confirmed via scanning electron microscopy (SEM) and transmission electron microscopy (TEM). The long-term cellularity and osteogenic differentiation of hMSCs in response to the different compositional ratios were then assessed by quantifying the timed expression of genes indicative of osteogenic differentiation, alkaline phosphatase activity, and DNA content over time. Decreased cellularity and the expression of genes over time correlated with increasing compositional ratios between HANP and PA-RGDS. The highest HANP to PA-RGDS ratio (66% HANP) exhibited the greatest improvement to the osteogenic differentiation of hMSCs. Overall, these results demonstrate that the compositional ratio of biphasic nanomatrix composites plays an important role in influencing the osteogenic differentiation of hMSCs. Based on the observations presented within this study, these biphasic nanomatrix composites show promise for future usage in bone tissue engineering applications.


Figures

Figure 1
Figure 1. General Scheme
Bone analogous nanomatrix composites in which HANPs are encapsulated by PA nanofibers tailored with the RGDS binding motif to mimic the native ECM of bone were fabricated. These composites were fabricated at various HANP to PA-RGDS ratios to assess how variations in the nanomatrix composition influence the osteogenic differentiation of hMSCs. It was hypothesized that the composites with the highest HANP to PA-RGDS ratio are the most conducive to osteogenic differentiation.
Figure 2
Figure 2. Characterization of nanomatrix composites
TEM images of (A) HANPs and (B) PA-RGDS (16% HANP) at 42000×. SEM Images of (C) PA-RGDS (16% HANP) (D) PA-RGDS (33% HANP) (E) PA-RGDS (50% HANP) and (F) PA-RGDS (66% HANP) at 1000×. Scale bars represent 100 nm for TEM and 50μm for SEM respectively. Considered together, TEM and SEM images demonstrate aggregates of varying size and distribution made up of HANPs enmeshed within PA nanofibers.
Figure 3
Figure 3. Initial Attachment and Cellularity over 28 days
Cells were first assessed for attachment on all surfaces at 1 hour, following which, they were assessed for cellularity over 28 days. Overall, nanomatrix composite conditions exhibited greater attachment than PA-RGDS alone. Over the 28 day time frame, there were step-wise decreases in cellularity, with differences first manifesting at the 14 day time point. Values are expressed as a mean ± standard error of measurement (* p < 0.05, **p<0.01).
Figure 4
Figure 4. Cellular viability over 7 days
(A) PA-RGDS, (B) PA-RGDS (16% HANP), (C) PA-RGDS (33% HANP), (D) PA-RGDS (50% HANP), and (E) PA-RGDS (66% HANP). Cells on all culture conditions were imaged utilizing a Live/Dead assay kit over 7 days. Overall, there were no differences in terms of viability between the nanomatrix composites and PA-RGDS. Images are taken at 20×. Scale bars represent 100 μM.
Figure 5
Figure 5. ALP Activity over 28 days
Over the 28 day time frame, there were step-wise increases in ALP activity based on increases in the HANP to PA-RGDS ratios. The 66% HANP nanomatrix composite condition demonstrated the greatest ALP activity over the course of the experiment. Values are expressed as a mean ± standard error of measurement (*p<0.05, **p<0.01).
Figure 6
Figure 6. Gene expression profile for Runx2 over 28 days
Runx2 gene expression peaked at the day 14 time point on all conditions, with enhancements linearly increasing based on increasing HANP to PA-RGDS ratios. The early expression for the 66% HANP condition at day 7 demonstrates its improved capability for osteoinduction relative to other conditions. Values are expressed as a mean ± standard error of measurement relative to TCP (dashed line) for all incubation periods. (p< 0.05, **p<0.01).
Figure 7
Figure 7. Gene expression profile for ALP over 28 days
At day 7, the 66% HANP containing composite had the greatest expression. For all conditions, ALP peaked at day 14 with greater expression exhibited in conditions with higher HANP to PA-RGDS ratios. Values are expressed as a mean ± standard error of measurement relative to TCP (dashed line) for all incubation periods. (*p < 0.05, **p<0.01).
Figure 8
Figure 8. Gene expression profile for OCN over 28 days
For all conditions, OCN expression is the most pronounced at the 14 and 28 day time points with expression increasing in a step-wise fashion based on increasing HANP to PA-RGDS ratios. OCN expression is greatest at day 28, with the 66% HANP containing composite demonstrating the greatest increase. Values are expressed as a mean ± standard error of measurement relative to TCP (dashed line) for all incubation periods. (*p < 0.05, **p<0.01).

Similar articles

Cited by

References

    1. Clarke B. Normal bone anatomy and physiology. Clinical journal of the American Society of Nephrology: CJASN. 2008;3 (Suppl 3):S131–9. - PMC - PubMed
    1. Ashman RF, Buckwalter JA, Devane P, Dobbs MB, Ferguson PJ, Flatow EL, et al. Turek’s Orthopaedics: Principles and Their Application. 6. Iowa City: Lippincott Williams and Wilkins; 2005.
    1. Bonzani IC, George JH, Stevens MM. Novel materials for bone and cartilage regeneration. Current opinion in chemical biology. 2006;10:568–75. - PubMed
    1. Couchman JR, Austria MR, Woods A. Fibronectin-cell interactions. The Journal of investigative dermatology. 1990;94:7S–14S. - PubMed
    1. Hartgerink JD, Beniash E, Stupp SI. Self-assembly and mineralization of peptide-amphiphile nanofibers. Science. 2001;294:1684–8. - PubMed

Publication types

MeSH terms

LinkOut - more resources