. 2012 Oct;13(10):981-90.
doi: 10.1038/ni.2390. Epub 2012 Jul 29.

OX40 signaling favors the induction of T(H)9 cells and airway inflammation

Affiliations

OX40 signaling favors the induction of T(H)9 cells and airway inflammation

Xiang Xiao et al. Nat Immunol. 2012 Oct.

Abstract

The mechanisms that regulate the T(H)9 subset of helper T cells and diseases mediated by T(H)9 cells remain poorly defined. Here we found that the costimulatory receptor OX40 was a powerful inducer of T(H)9 cells in vitro and T(H)9 cell-dependent airway inflammation in vivo. In polarizing conditions based on transforming growth factor-β (TGF-β), ligation of OX40 inhibited the production of induced regulatory T cells and the T(H)17 subset of helper T cells and diverted CD4(+)Foxp3(-) T cells to a T(H)9 phenotype. Mechanistically, OX40 activated the ubiquitin ligase TRAF6, which triggered induction of the kinase NIK in CD4(+) T cells and the noncanonical transcription factor NF-κB pathway; this subsequently led to the generation of T(H)9 cells. Thus, our study identifies a previously unknown mechanism for the induction of T(H)9 cells and may have important clinical implications in allergic inflammation.


Conflict of interest statement

COMPETING INTERESTS STATEMENT

The authors have no conflict of interests to declare.

Figures

Figure 1
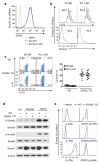
Figure 1. Role of OX40 signaling in polarization of naive CD4+ T cells in vitro
Naive CD4+ T cells sorted from WTB6, Ox40 KO, and OT-II Foxp3gfp reporter mice were cultured under iTreg, TH17, or TH9 polarizing conditions in vitro with or without engaging OX40 signaling, and induction of iTregs, TH17, and TH9 cells on day 3 was shown. (a) Induction of iTregs under polyclonal (anti-CD3) and antigen-specific settings (OVA323–339) in which WT APCs (WT) and OX40L-tg APCs (OX40L-TG) were used to activateCD4+ T cells. CD4+ T cells cultured without polarizing cytokines were included as controls (Ctrl). Numbers in quadrants denote the relative percentage of cells. The plot shown is a representative plot of 5 independent experiments. (b)Induction of TH17 cells under polyclonal and antigen-specific settings as described above. Numbers in quadrants denote the percentage of cells. The plot shown is a representative plot of 5 independent experiments. (c) Induction of TH9 cells from naïve B6 CD4+ T cells stimulated with anti-CD3+ WT APCs (WT) or OX40L-tg APCs (OX40L-TG). The panel on the right is a summary of all experiments performed and the dots denote individual experiments (n=10). (d)Naive CD4+ T cells were activated with anti-CD3plus WTAPCs with or without an agonist anti-OX40 mAb (OX86), and induction of TH9 cells was shown. The panel on the right is a summary of individual experiments (n=10). (e) Naïve B6 and Ox40 KO CD4+ T cells were activated with anti-CD3and APCs under TH9-polarizing conditions, and induction of IL-9 producing cells was shown. The panel on the rights is a summary of all experiments (n=10). * p <0.05.
Figure 2
Figure 2. Role of OX40 ligation in polarization of OT-II T cell subsets in vitro
Naive OT-II CD4+ cells were stimulated with the cognate OVA antigen presented by either wt APCs (WT) or OX40L-tg APCs (OX40L-TG), with or without the TH9 polarizing cytokines, and induction of TH9 cells was assessed by flow cytometry, quantitative PCR, and ELISA. (a) Conversion of naive OT-II cells to TH9 cells with or without OX40 ligation on day 3; the data shown is a representative flow cytometryplot. The panel on the right represents all experiments, and dots denote individual experiments (n=10). (b) OT-II cells were polarized under TH9 conditions for 3 days, and IL-9 expression was assessed by co-staining for other cytokines. Data shown are representative plots of 4 individual experiments. (c) OT-II cells were activated with OVA presented by WTAPCs (WT) and OX40Ltg APCs (OX40L-TG) for various times, and IL-9 expression was quantified by Real-Time PCR. Data shown are mean ±SEM of 3 experiments. (d) OT-II cells were activated with OVA plus WTAPCs (WT) or OX40Ltg APCs (OX40L-TG) for various times, and production of IL-9 in the culture supernatants was assessed by ELISA. Data shown are mean ± SEM of 3experiments.
Figure 3
Figure 3. Role of PU.1 and cytokine signaling in OX40-mediated induction of TH9 cells
(a) Naive CD4+ T cells sorted from wt B6 and PU.1 (Sfp1) deleted mice were activated with anti-CD3and APCs for 3 days and OX40 expression was assessed by flow cytometry and shown. (b) Proliferation and survival of WT-B6 and Sfp1 KOCD4+ T cells as determined by CFSE dilutions and Annexin V staining 3 days after activation with anti-CD3and WT APC. (c) Naive CD4+ T cells from WTB6 and Sfp1 KO mice were activated with anti-CD3 plus wt APCs (WT) or OX40Ltg APCs (OX40L-TG) under TH9-polarizing conditions for 3 days, and induction of TH9 cells was shown. Numbers in quadrants indicate the percentage of in each section, and the panel on the right summaries all experiments with dots denoting individual experiments. (d) Immunoblotting analysis of Smad2, Smad3, Smad7 in CD4+ Tconv activated with anti-CD3 plus WT APCs (WT) or OX40Ltg APCs (OX40L-TG) with or without additional TGF-β. The plot shown represents 1 of 4 experiments 24 hrs after T cell activation. (e) Expression of IL-2Rα, IL-4Rα, and IL-6Rα as well as activation of Stat5, Stat6, and Stat3, respectively, in CD4+ Tconv activated with anti-CD3 plus either WTAPCs (WT) or OX40Ltg APCs (OX40L-TG). The analysis was done 24 hrs after T cell activation and unstimulated naive T cell were included in the analysis as controls. Data are representative of 1 of 3 independent experiments.
Figure 4
Figure 4. Role of OX40 ligation in the activation of both canonical and non-canonical NF-kB pathways
Naive CD4+ Tconv were activated with anti-CD3plus WT APCs (WT) or OX40Ltg APCs (OX40L-TG), and at different time points, cytosolic (Cyt) and nucleus (Nuc) proteins were extracted and examined for NF-kB activation by immunoblotting. Naive unstimulated CD4+ T cells were used as controls. (a, b) Induction of the canonical (p50-RelA) and non-canonical (p52-RelB) NF-kB pathways in the cytosol (a) and nucleus (b) 36 hrs after T cell activation is shown. (c, d) Time-dependent assessment of p50-RelA and p52-RelB pathways (from 1 hr to 72 hrs following T cell activation) in the cytosol (Cyt) and nucleus (Nuc). β-actin and HDAC1 (histone deacetylase 1) were used as loading controls. Data shown are representative of 1 of 3 independent experiments.
Figure 5
Figure 5. Role of the canonical NF-kB pathway in OX40-mediated induction of TH9 cells
(a, b) WT-B6 and IkBαΔN-TGCD4+ cells were activated for 24 hrs with anti-CD3 plus WT APCs (WT) or OX40Ltg APCs (OX40L-TG), and induction of p50-RelA and p52-RelB in the cytosol (Cyt) and nucleus (Nuc) was assessed by immunoblotting. The plot shown is representative data of 1 of 3 experiments. (c)Naive WT-B6 and IkBαΔN-TGCD4+ T cells were activated with anti-CD3plus WT APCs (WT) or OX40Ltg APCs (OX40L-TG) under TH9 polarizing conditions, and the plots shown are IL-9-producing cells on day 3, as determined by flow cytometry. Numbers in quadrants indicate relative percentage of cells in each section. The panel on the right is a summaryofTH9 cells and the dots represent individual experiments (n=10). (d) Phosphorylation of IkB in CD4+ T cells with or without the addition of different doses of an IkBα inhibitor, BAY11-7082, two days after stimulation. (e) WTB6 CD4+ T cells were stimulated with anti-CD3and OX40Ltg APCs under TH9 polarizing conditions, and BAY11-7082 was added as indicated. Induction of IL-9 producing cells was examined 3 days later. Data are representative of 1 of 3 independent experiments.
Figure 6
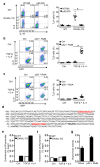
Figure 6. Role of the non-canonical NF-kB pathway in OX40-mediated induction of TH9 cells
(a) WT-B6 and p52-KO CD4+ T cells were activated with anti-CD3 plus WT APCs (WT) or OX40Ltg APCs (OX40L-TG) under TH9 polarizing conditions for 3 days, and induction TH9cells was shown. The panel on the right is the percentage of TH9 cells among naïve CD4+ T cells and the dots denote individual experiments (n=10). (b) Retroviral transduced WTCD4+ Tconv expressing RelB and p52 were cultured with or without TH9 polarizing cytokines for 3 days, and induction of TH9 cells was shown. The panel on the right depicts the results of all experiments (n=10). (c) WT-B6 CD4+ T cells were transduced with retroviral vectors encoding p50 and RelA, and IL-9 expression by the transduced T cells under TH9-polarizing conditions on day 3 was shown. The right panel depicts the results of all experiments (n=10). (d) Putative NF-kB binding sites in the IL-9 promoter region. The red color depicts the, and the TATA box is shown in bold font. (e) WTCD4+ T cells were activated with anti-CD3 plus either WT APCs (WT) or OX40Ltg APCs (OX40L-TG) under either neutral (Ctrl) or TH9 inducing conditions (TGF-β + IL-4), and enrichment of RelB at the IL-9 promoter region was determined by ChIP and shown. Data shown are representative of 1 of 3 independent experiments. (f) WTCD4+ T cells were cultured under either neutral or TH9 polarizing conditions, and ChIP of RelA binding to the IL-9 promoter region was shown. One of 3independent experiments is shown. (g) 293T cells were transfected with IL-9 promoter-luciferase construct with or without expression vectors encoding full-length RelB and p52. The promoter activity is presented as fold increase over cells transfected with the empty vector alone. Data are 1 of 3 independent experiments (mean ± SEM), * p<0.05.
Figure 7
Figure 7. Analysis of TRAF6 in OX40 triggered activation of non-canonical NF-kB pathway
(a) Naive WTCD4+ T cells were stimulated with anti-CD3 plus either WTAPCs (WT) or OX40Ltg APCs (OX40L-TG) for 48 hrs, and expression of Traf1 to Traf7 was quantitated by real-time PCR. (b) Immunoblotting showing strikingly different TRAF6 expression in activated CD4+ T cells with or without OX40 ligation at various time points. (c, d) Naive WT-B6and TRAF6 deleted (Traf6f/fCd4cre) CD4+ T cells (T6f/f) were activated with wt APCs (WT) or OX40Ltg APCs (OX40L-TG) under either neutral or TH9-polarzing conditions for 48 hrs. Cytosolic (Cyt) and nucleus (Nuc) proteins were extracted and expression of p105, p100, RelA, RelB, p52, p50, and NIK was assessed simultaneously by immunoblotting and compared. Data were representative of 3 independent experiments. * p<0.05.
Figure 8
Figure 8. Conditional deletion of Traf6 in CD4+ T cells prevents TH9 induction by OX40
(a) OX40 expression by activated WTB6 (Act WT) and TRAF6-deleted CD4+ T cells (Act T6f/f) 3 days after activation. One of 3 experiments is shown. (b) Proliferation and survival of wt B6 and Traf6-deleted CD4+ T cells (T6f/f) 3days after anti-CD3and APC stimulation. One of 3 experiments is shown. (c) Naive WT-B6and Traf6f/fCd4cre CD4+ T cells (T6f/f) were activated with anti-CD3plus either WT APCs (WT) or OX40Ltg APCs (OX40L-TG) under TH9 polarizing conditions for 3 days, and induction of IL-9 producing cells was determined by flow cytometry. The panel on the right shows the summary of TH9 cell frequency induced in all experiments; the dots denote individual experiments (n=10). (d) Activated CD4+ cells from Traf6f/fCd4cre mice were transduced with retroviral vectors encoding p52 and RelB or control vectors. The transduced T cells were cultured under TH9 polarizing conditions (without OX40 ligation) for 3 days, and induction of IL-9 producing cells among the successfully transduced T cells (marked by GFP expression) was determined by flow cytometry. The right panel indicates the relative frequency of TH9 cells induced in all experiments (n=10). (e) Activated CD4+ T cells from Traf6 deleted mice were transduced with retroviral vectors encoding p50 and RelA, and further cultured under TH9 polarizing conditions for 3 days. IL-9 expression was assessed by flow cytometry and shown. The right panel shows the summary of all experiments (n=10). * p<0.05.
Figure 9
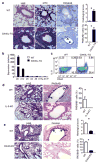
Figure 9. The in vivo effect ofOX40 in TH9 induction and airway inflammation
(a) Tissue pathology in the lungs of wt B6 and OX40Ltg mice (20 wks of age), as assessed by H&E, MTC, and PAS&AB staining. The pictures shown are representative of 5 animals in each group. The arrows denote mucin-producing cells in the airway epithelium; the histograms show quantitative histology scores and % of PAS&AB+ cells among airway epithelial cells. Magnifications, 400X. (b) Quantitative RT-PCR analysis of a panel of cytokines in the lung samples from wt B6 and OX40Ltg mice. Data shown are mean ±SEM of 3 animals. (c) Tissue infiltrating cells in the lungs of WTB6 and OX40Ltg mice were isolated and examined for IL-9 expression by flow cytometry. Cells were labeled with anti-CD4 and anti-CD44, and IL-9 expression in the CD4+ population was shown. One of 10 experiments is shown. (d) WT and IL-9-KO mice were briefly treated with an agonist anti-OX40 mAb, as described in the Methods section, and changes in the lung airways were assessed by H&E (100X) and PAS&AB staining (400X). The arrows denote mucin-producing cells in the airway epithelium. The pictures shown are representative of 5 animals in each group. The histogram shows the % of mucin-producing cells relative to airway epithelial cells. (e) WTB6 mice and OX40-KO mice were firstly sensitized and then re-challenged with OVA, and the lung tissue pathology as well as airway inflammation were shown. The arrows show mucing-producing cells, and the histograms depict quantitative histology scores and mucin-producing cells. Each group included 3 animals. * p < 0.05.

Comment in

  • Yoking OX40 to regulation of IL-9.
    Goswami R, Kaplan MH. Goswami R, et al. Nat Immunol. 2012 Oct;13(10):942-3. doi: 10.1038/ni.2421. Nat Immunol. 2012. PMID: 22990899 Free PMC article.

Similar articles

Cited by

References

    1. Janeway CA, Bottomly K. Signals and signs for lymphocyte responses. Cell. 1994;76:275–285. - PubMed
    1. Li XC, Rothstein DM, Sayegh MH. Costimulatory pathways in transplantation: challenges and new developments. Immunological Reviews. 2009;229:271–293. - PubMed
    1. Dong C. Diversification of T helper cell lineages: finding the family root of IL-17-producing cells. Nat Rev Immunol. 2006;6:329–334. - PubMed
    1. Bettelli E, et al. Reciprocal developmental pathways for the generation of pathogenic effector Th17 and regulatory cells. Nature. 2006;441:235–238. - PubMed
    1. Staudt V, et al. Interferon-regulatory factor 4 is essential for the developmental program of T helper 9 cells. Immunity. 2010;33:192–202. - PubMed

Publication types

MeSH terms