. 2012 Sep;13(9):832-42.
doi: 10.1038/ni.2376. Epub 2012 Jul 29.

Tumor-infiltrating DCs suppress nucleic acid-mediated innate immune responses through interactions between the receptor TIM-3 and the alarmin HMGB1

Affiliations

Tumor-infiltrating DCs suppress nucleic acid-mediated innate immune responses through interactions between the receptor TIM-3 and the alarmin HMGB1

Shigeki Chiba et al. Nat Immunol. 2012 Sep.

Abstract

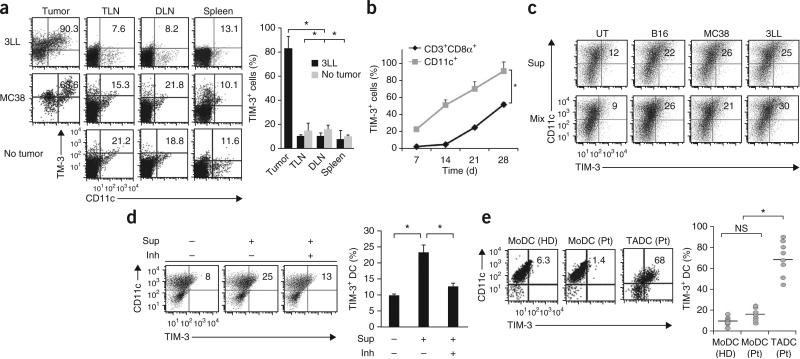
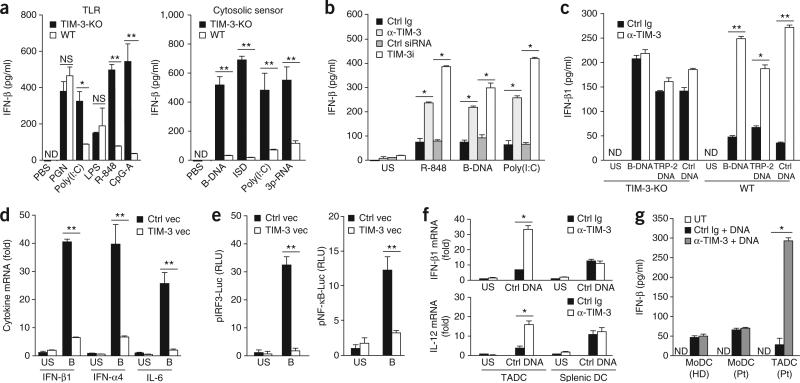
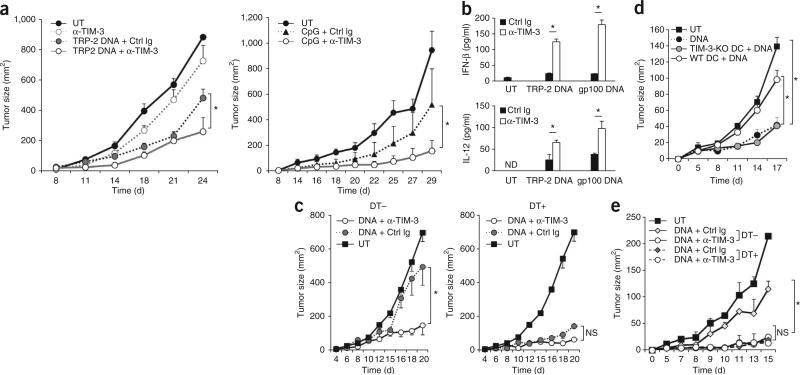
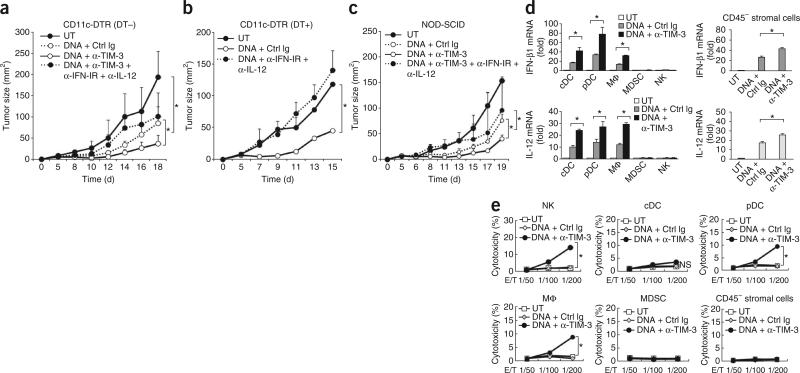
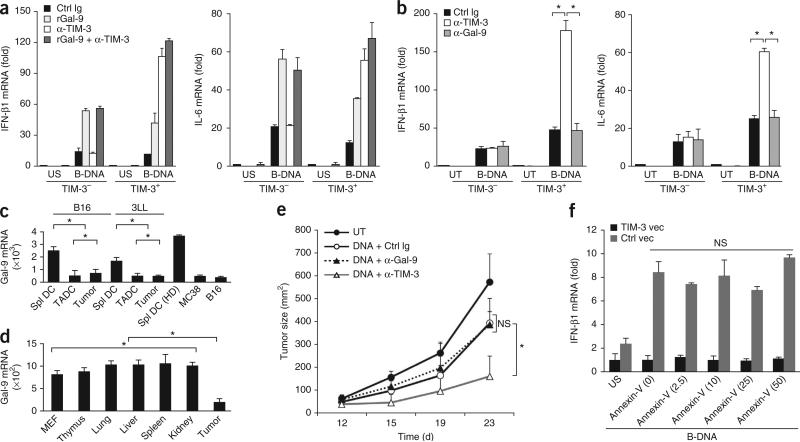
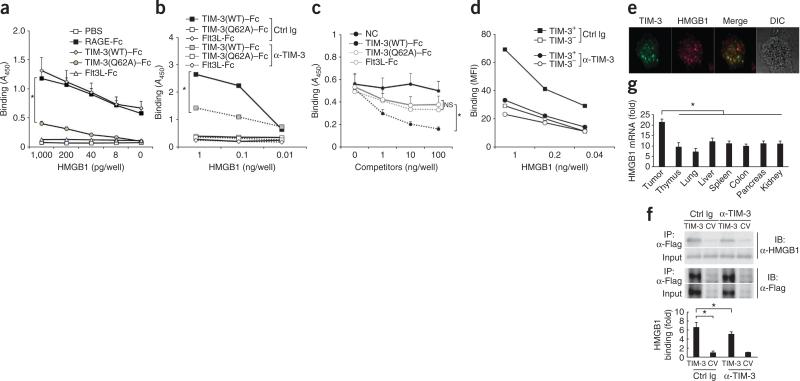
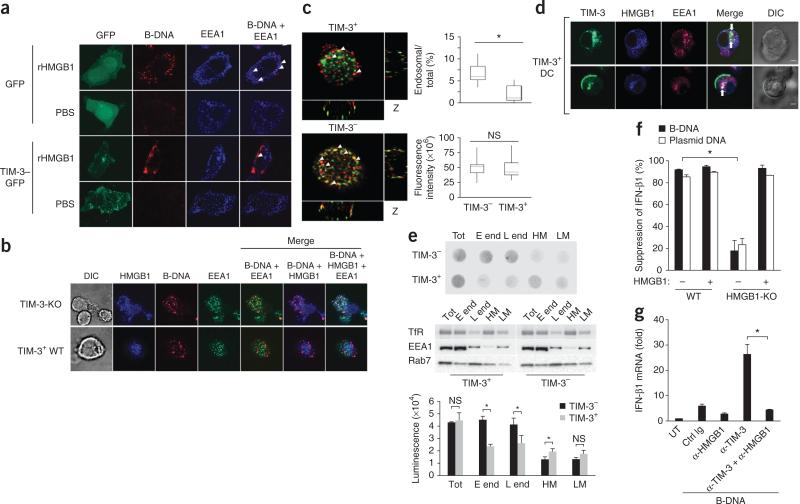
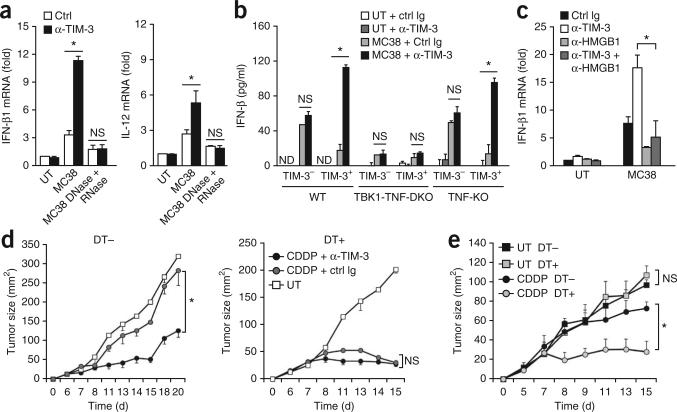
The mechanisms by which tumor microenvironments modulate nucleic acid-mediated innate immunity remain unknown. Here we identify the receptor TIM-3 as key in circumventing the stimulatory effects of nucleic acids in tumor immunity. Tumor-associated dendritic cells (DCs) in mouse tumors and patients with cancer had high expression of TIM-3. DC-derived TIM-3 suppressed innate immune responses through the recognition of nucleic acids by Toll-like receptors and cytosolic sensors via a galectin-9-independent mechanism. In contrast, TIM-3 interacted with the alarmin HMGB1 to interfere with the recruitment of nucleic acids into DC endosomes and attenuated the therapeutic efficacy of DNA vaccination and chemotherapy by diminishing the immunogenicity of nucleic acids released from dying tumor cells. Our findings define a mechanism whereby tumor microenvironments suppress antitumor immunity mediated by nucleic acids.


Figures

Figure 1
Figure 1
Expression of TIM-3 on TADCs. (a) TIM-3 expression by DCs from established tumors (Tumor), tumor-draining lymph nodes (TLN), distal lymph nodes (DLN) or spleens of mice bearing 3LL or MC38 tumors at 28 d after tumor inoculation, and from tumor-free mice (No tumor; control), analyzed by flow cytometry (left). Numbers in top right quadrants indicate percent TIM-3+CD11c+ cells. Right, TIM-3+ cells among CD11c+ cells isolated from mice bearing 3LL tumors or no tumors (average). (b) Longitudinal analysis of TIM-3-expressing CD11c+ DCs or CD3+CD8+ T cells (Cd3+CD8α+) after inoculation of 3LL tumors. (c) TIM-3 expression by BMDCs left untreated (UT) or treated for 48 h with supernatants of B16, MC38 or 3LL tumor cells (20% in total medium; Sup) or cultured for 48 h together with those tumor cells (Mix), evaluated by flow cytometry (numbers in plots as in a). (d) TIM-3 expression on BMDCs left untreated (Sup –) or treated for 48 h with supernatants of 3LL cell cultures (Sup +) left untreated (Inh –) or treated with anti-VEGF-R2, anti-IL-10 and inhibitor of arginase I (Inh +), evaluated by flow cytometry (left; numbers in plots as in a). Right, frequency of TIM-3+CD11c+ DCs. (e) TIM-3 expression on DCs differentiated from peripheral blood monocytes (MoDCs) from healthy donors (HD; n = 7) or patients with cancer (Pt; n = 7), and TADCs from those same patients (n = 9), evaluated by flow cytometry (left; numbers in plots as in a). Right, frequency of TIM-3+CD11c+ DCs; each symbol represents an individual donor, and small horizontal lines indicate the mean. NS, not significant. *P < 0.05 (paired Student's t-test). Data are representative of four experiments (a–d; error bars (a,b,d), s.e.m.) or three experiments (e).
Figure 2
Figure 2
TIM-3 suppresses innate responses to nucleic acids. (a) Enzyme-linked immunosorbent assay (ELISA) of IFN-β in wild-type TIM-3+ BMDCs (WT) or TIM-3-deficient TIM-3 BMDCs (TIM-3-KO) stimulated with PBS or various TLR ligands (left: peptidoglycan (PGN), poly(I:C), lipopolysaccharide (LPS), R-848 or CpG ODN1585 (CpG-A)) or agonists of cytosolic sensors (right: B-DNA, interferon-stimulatory DNA (ISD), poly(I:C) or triphosphate RNA (3p-RNA)). (b) ELISA of IFN-β1 in wild-type TIM-3+ DCs treated with control immunoglobulin (Ctrl Ig), mAb to TIM-3 (α-TIM-3), control small interfering RNA (Ctrl siRNA) or small interfering RNA specific for TIM-3 (TIM-3i), followed by no stimulation (unstimulated (US)) or stimulation for 8 h with PBS, R-848, B-DNA or poly(I:C). (c) ELISA of IFN-β1 in wild-type TIM-3+ or TIM-3-deficient TIM-3 BMDCs pretreated with control immunoglobulin or mAb to TIM-3, followed by no stimulation or stimulation for 12 h with B-DNA, plasmid encoding TRP-2 (TRP-2 DNA) or plasmid without insert (Ctrl DNA). (d) Quantification of IFN-β1, IFN-α4 and IL-6 mRNA in MEFs transfected for 24 h with control vector (Ctrl vec) or vector encoding TIM-3 (TIM-3 vec), followed by no stimulation or stimulation for 8 h with B-DNA (B); results are presented relative to the expression of Actb (reference gene encoding β-actin). (e) Luciferase activity in lysates of HEK293T cells transfected and treated as in d, assessing the activity of IRF3 (pIRF3-Luc) or NF-κB (pNF-κB-Luc); results are presented in relative light units (RLU) relative to the activity of renilla luciferase. (f) RT-PCR quantification of IFN-β1 and IL-12 mRNA in TADCs and splenic DCs isolated from tumor-bearing mice treated with control immunoglobulin or mAb to TIM-3, followed by no stimulation or stimulation for 8 h with plasmid DNA (Ctrl DNA); results are presented relative to Actb expression. (g) ELISA of IFN-β in DCs differentiated from peripheral blood monocytes from healthy donors or patients with NSCLC, and TADCs from those same patients, left untreated or pretreated with control immunoglobulin or mAb to TIM-3, followed by stimulation with B-DNA (+ DNA). *P < 0.05 and **P < 0.01 (paired Student's t-test). Data are representative of five experiments (a), four experiments (b,c) or three experiments (d–g; error bars, s.e.m.).
Figure 3
Figure 3
TIM-3 impedes the in vivo antitumor activities of DNA. (a) Tumor growth in wild-type C57BL/6 mice (n = 4 per group) left untreated or inoculated subcutaneously in the flank with B16-F10 melanoma cells, then given intratumoral injection of mAb to TIM-3 alone (left) or of plasmid encoding mouse TRP-2 (TRP-2 DNA; left) or CpG-ODN (CpG; right) in the presence of control immunoglobulin or mAb to TIM-3 (key). (b) ELISA of IFN-β and IL-12 in lysates of B16-F10 tumors isolated from untreated mice or mice treated with plasmid encoding TRP-2 or gp100 in the presence of control immunoglobulin or mAb to TIM-3 (key). (c) Tumor growth in CD11c-DTR mice given no treatment with diphtheria toxin (DT–) or treated with diphtheria toxin (DT+), then left untreated or inoculated subcutaneously with B16-F10 melanoma cells (1 × 10⁵ cells per mouse) along with control plasmid DNA in the presence of mAb to TIM-3 or isotype-matched control immunoglobulin. (d) Tumor growth in diphtheria toxin–treated CD11c-DTR mice (n = 5 per group) given no treatment (UT), control plasmid alone (DNA) or adoptive transfer of DCs derived from wild-type or TIM-3-deficient bone marrow, along with intratumoral injection of control plasmid DNA into established B16-F10 tumors. (e) Tumor growth in chimeras reconstituted with a mixture of bone marrow cells from TIM-3-deficient mice and CD11c-DTR mice given no treatment with diphtheria toxin or treated with diphtheria toxin 2 d before inoculation with B16-F10 tumor cells (1 × 10⁵ cells per mouse), then left untreated (UT) or treated 8, 10 and 12 d later with control plasmid DNA in the presence of isotype-matched control immunoglobulin or mAb to TIM-3 after tumor inoculation. *P < 0.05 (paired Student's t-test). Data are representative of four experiments (a), three experiments (b,c), two independent experiments (d) or two experiments (e; error bars, s.e.m.).
Figure 4
Figure 4
Type I interferon and IL-12 mediate anti-TIM-3-mediated antitumor responses. (a–c) Tumor growth in CD11c-DTR mice given no treatment with diphtheria toxin (a) or treated with diphtheria toxin (b), and in NOD-SCID mice (c), left untreated (control) or inoculated subcutaneously with B16-F10 cells (1 × 10⁵ cells per mouse) along with intratumoral injection of control plasmid DNA in the presence of isotype-matched control immunoglobulin or mAb to TIM-3, alone or with neutralizing anti-IFN-IR and anti-IL-12p40. (d) RT-PCR quantification of IFN-β1 and IL-12 mRNA in conventional DCs (cDC), plasmacytoid DCs (pDC), macrophages (MΦ), myeloid-derived suppressor cells (MDSC), natural killer cells (NK; left) or stromal cells isolated from B16 tumors grown in NOD-SCID mice (right), left untreated or treated with control plasmid DNA plus isotype-matched control immunoglobulin or mAb to TIM-3; results are presented relative to Actb expression. (e) Cytotoxicity of the cells in d (effector cells; E) cultured together for 6 h with B16 cells (target cells; T) at various ratios (E/T), assessed by lactate dehydrogenase–release assay. *P < 0.05 (paired Student's t-test). Data are representative of three experiments (a,c–e) or four experiments (b; error bars, s.e.m.).
Figure 5
Figure 5
TIM-3 regulates innate responses by a galectin-9-independent mechanism. (a) RT-PCR analysis of IFN-β1 and IL-6 mRNA in wild-type TIM-3+ and TIM-3 BMDCs pretreated with isotype-matched control immunoglobulin, recombinant galectin-9 (rGal-9) and/or mAb to TIM-3 (key), followed by no stimulation or stimulation for 8 h with B-DNA; results are presented relative to Actb expression. (b) RT-PCR quantification of IFN-β1 and IL-6 mRNA in TIM-3+ and TIM-3 BMDCs left untreated or treated for 24 h with B-DNA in the presence of isotype-matched control immunoglobulin, mAb to TIM-3 or mAb to galectin-9; results are presented relative to Actb expression. (c) RT-PCR quantification of galectin-9 (Gal-9) mRNA in splenic DCs (Spl DC), TADCs and tumor cells isolated from established B16 or 3LL tumors, splenic DCs from non-tumor-bearing mice (HD) and MC38 or 3LL tumor cells cultured in vitro; results are presented relative to Actb expression. (d) RT-PCR quantification of galectin-9 mRNA in MEFs, normal tissues (thymus, lung, liver, spleen and kidney) from tumor-bearing mice, and B16 tumors (Tumor); results are presented relative to expression of Gapdh (reference gene encoding glyceraldehyde phosphate dehydrogenase). (e) Tumor growth in C57BL/6 mice (n = 4 per group) left untreated or inoculated subcutaneously with B16-F10 melanoma cells (1 × 10⁵ cells per mouse) and given intratumoral injection of control plasmid DNA in the presence of isotype-matched control immunoglobulin or mAb to galectin-9 or TIM-3. (f) RT-PCR analysis of IFN-β1 mRNA in MEFs transfected for 24 h with vector encoding TIM-3 or control vector, then left unstimulated or stimulated with B-DNA in the presence of various concentrations of recombinant annexin V (horizontal axis; in ng/ml). *P < 0.05 (paired Student's t-test). Data are representative of three experiments (a–e) or two experiments (f; error bars, s.e.m.).
Figure 6
Figure 6
TIM-3 serves as a putative receptor for HMGB1. (a) Binding of biotin-labeled recombinant HMGB1 (concentration, horizontal axis) to plastic plates coated with PBS or fusions of Fc and RAGE (RAGE-Fc), wild-type TIM-3 (TIM-3(WT)–Fc), mutant TIM-3 (TIM-3(Q62A)–Fc) or the cytokine Flt3L (Flt3L-Fc), measured by colorimetric analysis and presented as absorbance at 450 nm (A450). (b) Binding of HMGB1 as in a in the presence of control immunoglobulin or mAb to TIM-3. (c) Binding of biotin-labeled B-DNA to plastic plates coated with HMGB1 in the absence (NC) or presence of TIM-3(WT)–Fc, TIM-3(Q62A)–Fc or Flt3L-Fc as cold competitors (concentrations, horizontal axis), measured and presented as in a. (d) Binding of biotin-labeled HMGB1 (concentration, horizontal axis) to wild-type TIM3+ or TIM-3 BMDCs during culture with control immunoglobulin or mAb to TIM-3, analyzed by flow cytometry and are presented as mean fluorescence intensity (MFI). (e) Confocal microscopy of TIM-3 (green) in TIM-3+ DCs loaded with recombinant HMGB1 (red). DIC, differential interference contrast. Original magnification, ×1,000. (f) Immunoassay (top) of lysates of MEFs transfected with vector encoding Flag-tagged TIM-3 or control vector (CV) and stimulated for 30 min with HMGB1 in the presence of control immunoglobulin or mAb to TIM-3, followed by immunoprecipitation (IP) with mAb M2 to the Flag tag and immunoblot analysis with anti-HMGB1 or anti-Flag. Bottom, band intensity of HMGB1–TIM-3 in MEFs transfected with TIM-3 relative to that in MEFs transfected with control vector (below). (g) RT-PCR quantification of HMGB1 mRNA in B16-F10 tumors and normal tissues; results are presented relative to Actb expression. *P < 0.05 (paired Student's t-test). Data are representative of five experiments (a,f), four experiments (b,c) or three experiments (d,e,g; error bars (a,c,d,f,g), s.e.m.).
Figure 7
Figure 7
TIM-3 inhibits the recruitment of nucleic acids into endosomes. (a) Microscopy of HMGB1-deficient MEFs transfected to express green fluorescent protein alone (GFP) or green fluorescent protein–tagged TIM-3 (TIM-3–GFP), then treated with recombinant HMGB1 (rHMGB1) or PBS, assessing the localization of B-DNA (red) in EEA1+ endosomes (blue). Original magnification, ×1,000. (b) Confocal microscopy of TIM-3-deficient DCs and TIM-3+ wild-type DCs ‘loaded’ with recombinant HMGB1 (blue), then stimulated with B-DNA, assessing the localization of B-DNA (red) in EEA1+ endosomes (green). Original magnification, ×1,000. (c) Quantification of the fluorescence intensity of total cellular B-DNA (red (left); bottom right) and B-DNA in EEA1+ endosomes (green (left)) relative to total cellular B-DNA (top right) in wild-type TIM-3+ or TIM-3 BMDCs in images (left) acquired from the bottom to the top of the cells in b. Original magnification, ×1,200. (d) Confocal microscopy of the localization of TIM-3 (green) and HMGB1 (blue) in EEA1+ endosomes (red) in TIM-3+ DCs. Original magnification, ×1,000. (e) Dot-blot analysis of B-DNA (top) and immunoblot analysis of transferrin receptor (TfR), EEA1 and the late endosome marker Rab7 (middle) in total lysates (Tot), early endosomes (E end), late endosomes (L end) and heavy (HM) or light (LM) plasma membrane fractions isolated from homogenized BMDCs 2 h after treatment with B-DNA. Bottom, quantification of the dot-blot results above. (f) Suppression of IFN-β1 in wild-type or HMGB1-deficient (HMGB1-KO) MEFs transfected to express TIM-3, followed by stimulation with B-DNA or control plasmid DNA with (+) or without (–) recombinant HMGB1; results are presented relative to those of cells transfected with control vector. (g) RT-PCR analysis of IFN-β1 mRNA in TIM-3+ BMDCs left untreated or pretreated with isotype-matched control immunoglobulin or anti-HMGB1 and/or mAb to TIM-3 (horizontal axis), followed by stimulation for 8 h with B-DNA; results are presented relative to Actb expression. *P < 0.05 (paired Student's t-test). Data are representative of four experiments (a), three experiments (b,e–g) or five experiments (d) or are pooled from three separate experiments with 30 cells (c; error bars (c,e–g), s.e.m.).
Figure 8
Figure 8
TIM-3 impedes the antitumor effects of chemotherapy. (a) Quantification of IFN-β1 and IL-12 mRNA in TIM-3+ BMDCs cultured alone (UT) or together with apoptotic CDDP-treated MC38 cells with (MC38 DNase + RNase) or without (MC38) pretreatment with DNase and RNase in the presence of control immunoglobulin or mAb to TIM-3; results are presented relative to Actb expression. (b) ELISA of IFN-β1 in TIM-3 and TIM-3+ wild-type BMDCs (WT), BMDCs deficient in TBK1 and TNF (TBK1-TNF-DKO) or TNF-deficient BMDCs (TNF-KO) cultured alone or together withdying MC38 cells in the presence of control immunoglobulin or mAb to TIM-3. (c) RT-PCR quantification of IFN-β1 and IL-12 mRNA in wild-type TIM-3+ DCs cultured alone or together with dying MC38 cells in the presence of control immunoglobulin or mAb to TIM-3 and/or anti-HMGB1 (key); results are presented relative to Actb expression. (d) Tumor growth in CD11c-DTR mice given no diphtheria toxin or treated with diphtheria toxin, then inoculated subcutaneously with MC38 cells along with systemic CDDP in the presence of mAb to TIM-3 or control immunoglobulin, or no treatment. (e) Tumor growth in chimeras reconstituted with a mixture (1:1) of bone marrow cells from CD11c-DTR and TIM-3-deficient mice, then given no treatment with diphtheria toxin or treated with diphtheria toxin 2 d before inoculation with MC38 cells, followed by no treatment or CDDP on days 8, 10 and 12 after inoculation. *P < 0.05 (paired Student's t-test). Data are representative of four experiments (a), five experiments (b) or three experiments (c–e; error bars, s.e.m.).

Comment in

References

    1. Hanahan D, Weinberg RA. Hallmarks of cancer: the next generation. Cell. 2011;144:646–674. - PubMed
    1. Schreiber RD, Old LJ, Smyth MJ. Cancer immunoediting: integrating immunity's roles in cancer suppression and promotion. Science. 2011;331:1565–1570. - PubMed
    1. Bindea G, Mlecnik B, Fridman WH, Pages F, Galon J. Natural immunity to cancer in humans. Curr. Opin. Immunol. 2010;22:215–222. - PubMed
    1. Dougan M, Dranoff G. Immune therapy for cancer. Annu. Rev. Immunol. 2009;27:83–117. - PubMed
    1. Rabinovich GA, Gabrilovich D, Sotomayor EM. Immunosuppressive strategies that are mediated by tumor cells. Annu. Rev. Immunol. 2007;25:267–296. - PMC - PubMed

Publication types

MeSH terms