. 2012 Sep;14(9):966-76.
doi: 10.1038/ncb2549. Epub 2012 Jul 29.

Dissecting DNA damage response pathways by analysing protein localization and abundance changes during DNA replication stress

Affiliations

Dissecting DNA damage response pathways by analysing protein localization and abundance changes during DNA replication stress

Johnny M Tkach et al. Nat Cell Biol. 2012 Sep.

Abstract

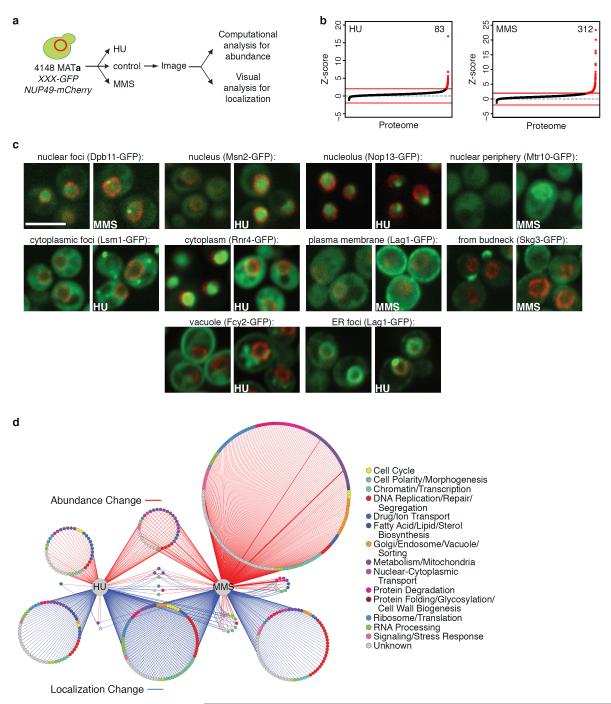
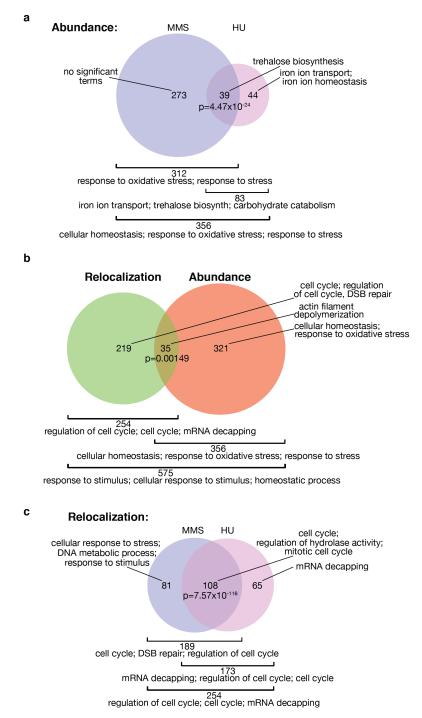
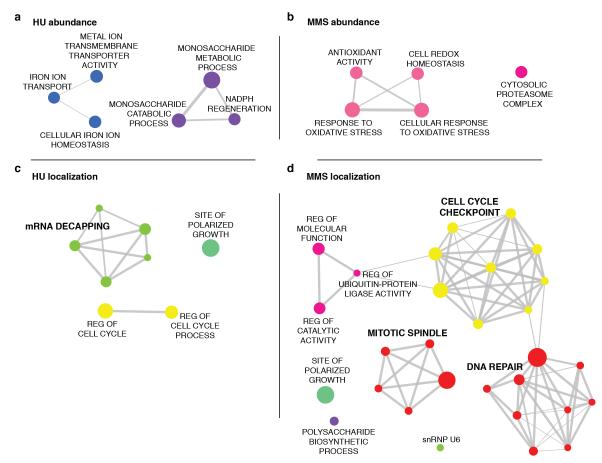
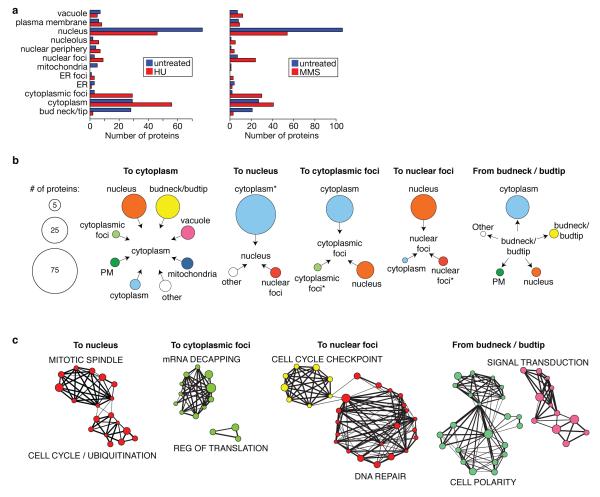
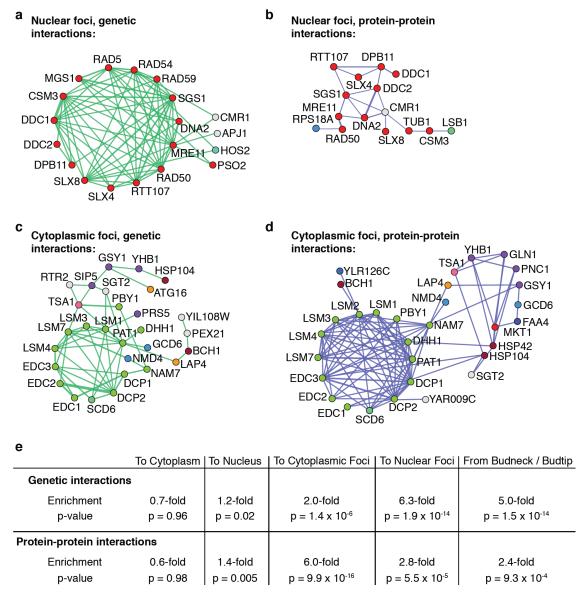
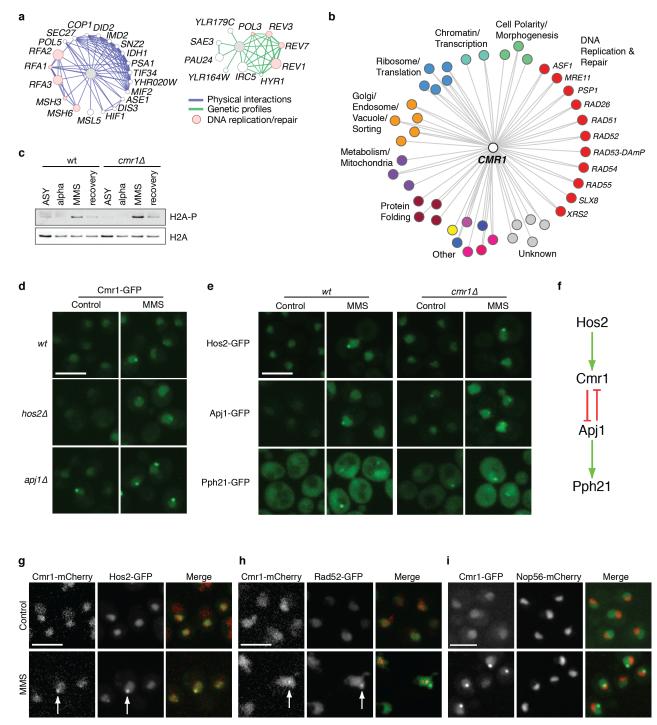
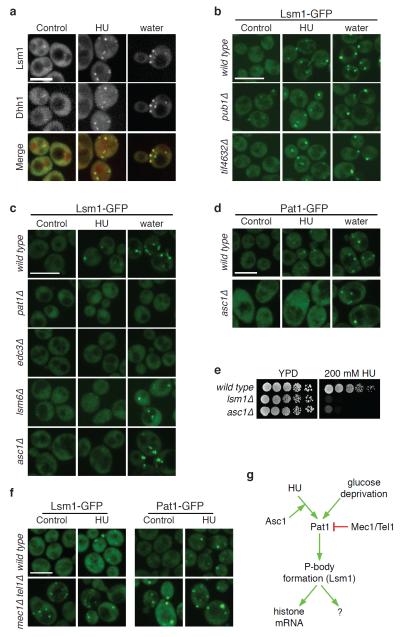
Relocalization of proteins is a hallmark of the DNA damage response. We use high-throughput microscopic screening of the yeast GFP fusion collection to develop a systems-level view of protein reorganization following drug-induced DNA replication stress. Changes in protein localization and abundance reveal drug-specific patterns of functional enrichments. Classification of proteins by subcellular destination enables the identification of pathways that respond to replication stress. We analysed pairwise combinations of GFP fusions and gene deletion mutants to define and order two previously unknown DNA damage responses. In the first, Cmr1 forms subnuclear foci that are regulated by the histone deacetylase Hos2 and are distinct from the typical Rad52 repair foci. In a second example, we find that the checkpoint kinases Mec1/Tel1 and the translation regulator Asc1 regulate P-body formation. This method identifies response pathways that were not detected in genetic and protein interaction screens, and can be readily applied to any form of chemical or genetic stress to reveal cellular response pathways.


Figures

Figure 1
Figure 1. High-throughput microscopic screening of yeast GFP collection
(a) Schematic of screening methodology. (b) Rank-order plots of Z-score for each protein screened (collectively designated as proteome) for abundance change measurements in HU (left) and MMS (right). Red lines indicate Z score cut-offs (−2 and 2). Proteins with Z-scores exceeding the cutoffs are coloured red. The number of proteins with Z > 2.0 is indicated. (c) High-throughput images of representative proteins for 10 re-localization classes. Left and right panels in each pair show control and drug-treated samples respectively. Green – GFP-fusion, Red – Nup49-mCherry. Note that Nup49-mCherry is not shown for Mtr10-GFP to show its localization at the nuclear periphery. Scale bar represents 5 μm. (d) Network summary of screen hits. Positives from the screen were organized based on type (abundance or localization) and inducing drug. Nodes represent proteins and are coloured by biological process. Red edges indicate abundance change with edge width proportional to the magnitude of change. Blue edges indicate localization change.
Figure 2
Figure 2. Comparison of biological process enrichment for MMS and HU abundance and localization positives
Venn diagrams summarizing overlap among abundance and localization positives. In all panels the number of genes in each group, enriched GO terms (see Methods) and a p-value for the significance of the overlap are indicated. (a) MMS vs. HU abundance positives. (b) All relocalization positives vs. all abundance positives. (c) MMS vs. HU relocalization positives.
Figure 3
Figure 3. Abundance and relocalization positives show drug-specific biological process enrichment
Gene set enrichment analysis was performed on protein groups showing abundance changes in HU (a) or MMS (b). Enrichment analysis using the hypergeometric method was used to identify enrichments in protein groups showing localization changes in HU (c) or MMS (d). Significant terms with an FDR < 0.01 are shown. Each node represents a single enriched biological process/protein complex and is coloured by biological process as in Figure 1d. Node size is proportional to prevalence of the GO-term in the GFP strain collection and edge width is proportional to the degree of gene overlap between two nodes. Some node names within a group were replaced with a general term for clarity. All node names are shown in Figure S3.
Figure 4
Figure 4. Global analysis of protein relocalization in response to replication stress
(a) The number of proteins in each subcellular compartment before (blue) and after (red) drug treatment. Left – HU, Right – MMS. (b) Relocalization maps illustrate the initial subcellular locations of proteins that contribute to each indicated relocalization class. The node size is proportional to the number of proteins (scale is indicated on left). For ‘To Nucleus’, proteins designated Cytoplasm* displayed a nuclear-cytoplasmic distribution before drug treatment, with the proportion of protein in the nucleus increasing after drug. For ‘To Cytoplasmic Foci’ and ‘To Nuclear Foci’, Cytoplasmic Foci* and Nuclear Foci* represent initial subcellular locations where the number of cells with foci or the intensity of the foci increased after drug. (c) Functional enrichment analysis of indicated relocalization classes. See Figure 3 legend for details. All node names are shown in Figure S5.
Figure 5
Figure 5. Relocalization change classes are enriched for protein-protein and genetic interactions
(a) to (d) Genetic and physical interaction networks for the indicated relocalization classes were generated using GeneMANIA. Nodes represent genes/proteins and edges represent interactions. All nodes are coloured by biological process as in Figure 1d. (e) Summary of interaction enrichments for the given relocalization classes. P-values calculated using the hypergeometric method. See Methods for details of analysis.
Figure 6
Figure 6. Cmr1 represents a novel class of DNA damage response foci
(a) CMR1 was used as the query in GeneMANIA to generate a network of 20 genes with highly correlated synthetic genetic profiles (left) and a network of 10 physically-interacting proteins (right). Node size is proportional to the degree of connectivity within the network and edge width is proportional to the confidence of the connection. The grey nodes represent the query ORF (CMR1) and the white nodes represent the ORFs returned by GeneMANIA. Nodes representing ORFs returned by GeneMANIA that function in DNA repair are coloured red. (b) SGA network for CMR1 negative genetic interactions. Nodes represent genes, and those connected by two edges indicate that the interaction was detected using CMR1 as both a query and an array strain. Nodes are coloured by biological process as in Figure 1d. (c) Western blot analysis for p-H2A. The indicated strains were arrested in G1, released into MMS for 1 h and allowed to recover in fresh YPD for 1 h. Cell lysates were probed for p-H2A and total H2A. The cmr1Δ strain shows a 1.7-fold increase in p-H2A signal compared to wild type after normalizing to total H2A. (d) Live cells expressing Cmr1-GFP and deleted for the indicated gene were imaged by confocal microscopy before (Control) or after MMS treatment. (e) Live cells expressing the indicated GFP-fusion protein and deleted for CMR1 were imaged by confocal microscopy before (Control) or after MMS treatment. (f) Model of the pathway regulating Cmr1 focus formation. (g) Live cells co-expressing Cmr1-mCherry and Hos2-GFP or (h) Rad52-GFP were imaged before (Control) and after MMS treatment. (i) Live cells co-expressing Cmr1-GFP and the nucleolar marker Nop56-mCherry were imaged before (Control) and after MMS treatment. Scale bars represent 5 μm.
Figure 7
Figure 7. P-body formation in response to HU is regulated by ASC1, MEC1 and TEL1
(a) Live cells co-expressing chromosomally tagged Lsm1-GFP and Dhh1-mCherry were imaged by confocal microscopy before (Control) and after treatment with HU or water. Live cells expressing Lsm1-GFP (b) and (c) or Pat1-GFP (d) and deleted for the indicated gene were imaged by confocal microscopy before (Control) and after treatment with HU or water. (e) Cultures of the indicated strains were serially diluted and spotted on YPD and YPD containing 200 mM HU and grown for 2-3 d. (f) Wild type cells (wild type) or strains deleted for MEC1 and TEL1 (mec1Δtel1Δ) expressing either Lsm1-GFP (left) or Pat1-GFP (right) were imaged by confocal microscopy before (Control) and after treatment with HU. (g) Regulation of P-body formation in response to HU-induced replication stress. Scale bars represent 5 μm.

Comment in

Similar articles

Cited by

References

    1. Gasch AP, et al. Genomic expression programs in the response of yeast cells to environmental changes. Mol Biol Cell. 2000;11:4241–4257. - PMC - PubMed
    1. Soufi B, et al. Global analysis of the yeast osmotic stress response by quantitative proteomics. Mol Biosyst. 2009;5:1337–1346. - PubMed
    1. Ingolia NT, Ghaemmaghami S, Newman JR, Weissman JS. Genome-wide analysis in vivo of translation with nucleotide resolution using ribosome profiling. Science. 2009;324:218–223. - PMC - PubMed
    1. Ptacek J, et al. Global analysis of protein phosphorylation in yeast. Nature. 2005;438:679–684. - PubMed
    1. Peng J, et al. A proteomics approach to understanding protein ubiquitination. Nat Biotechnol. 2003;21:921–926. - PubMed

References cited only in the Methods

    1. Brachmann CB, et al. Designer deletion strains derived from Saccharomyces cerevisiae S288C: a useful set of strains and plasmids for PCR-mediated gene disruption and other applications. Yeast. 1998;14:115–132. - PubMed
    1. Sherman F. Getting started with yeast. Methods Enzymol. 2002;350:3–41. - PubMed
    1. Winzeler EA, et al. Functional characterization of the S. cerevisiae genome by gene deletion and parallel analysis. Science. 1999;285:901–906. - PubMed
    1. Subramanian A, et al. Gene set enrichment analysis: a knowledge-based approach for interpreting genome-wide expression profiles. Proc Natl Acad Sci U S A. 2005;102:15545–15550. - PMC - PubMed
    1. Benschop JJ, et al. A consensus of core protein complex compositions for Saccharomyces cerevisiae. Mol Cell. 2010;38:916–928. - PubMed

Publication types

MeSH terms

Substances