. 2012 Nov 1;21(21):4680-702.
doi: 10.1093/hmg/dds309. Epub 2012 Jul 27.

Mitochondrial metabolism in Parkinson's disease impairs quality control autophagy by hampering microtubule-dependent traffic

Affiliations

Mitochondrial metabolism in Parkinson's disease impairs quality control autophagy by hampering microtubule-dependent traffic

Daniela M Arduíno et al. Hum Mol Genet. .

Abstract

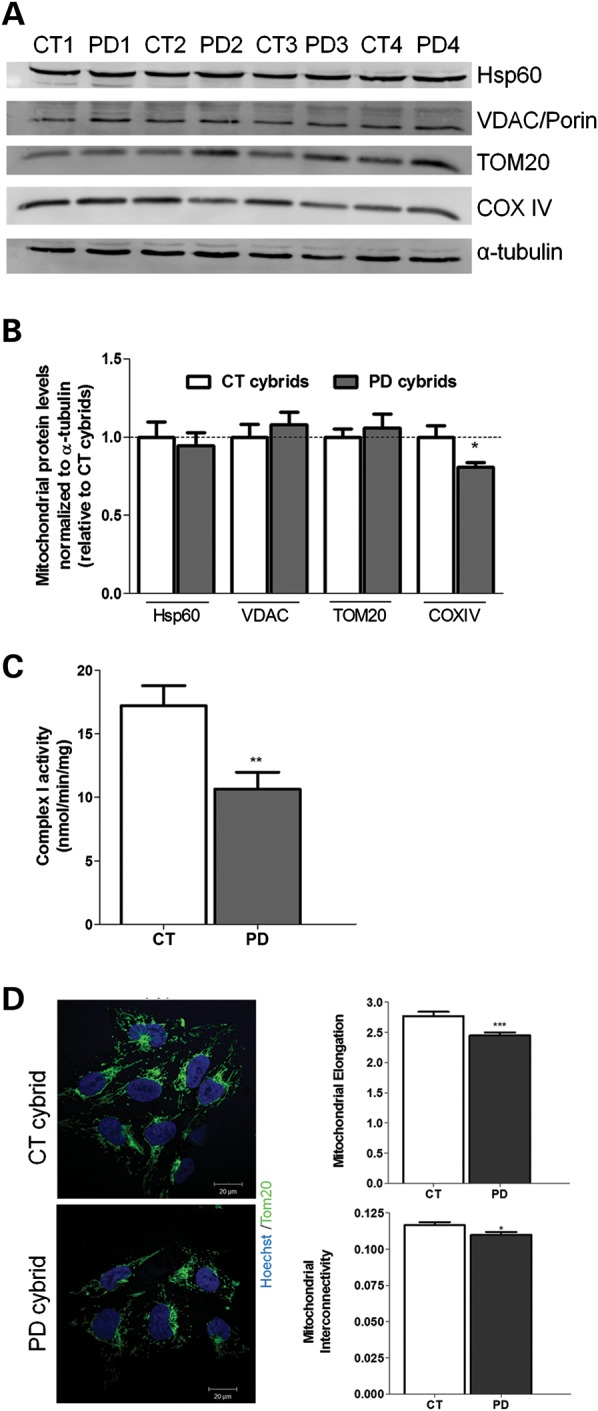
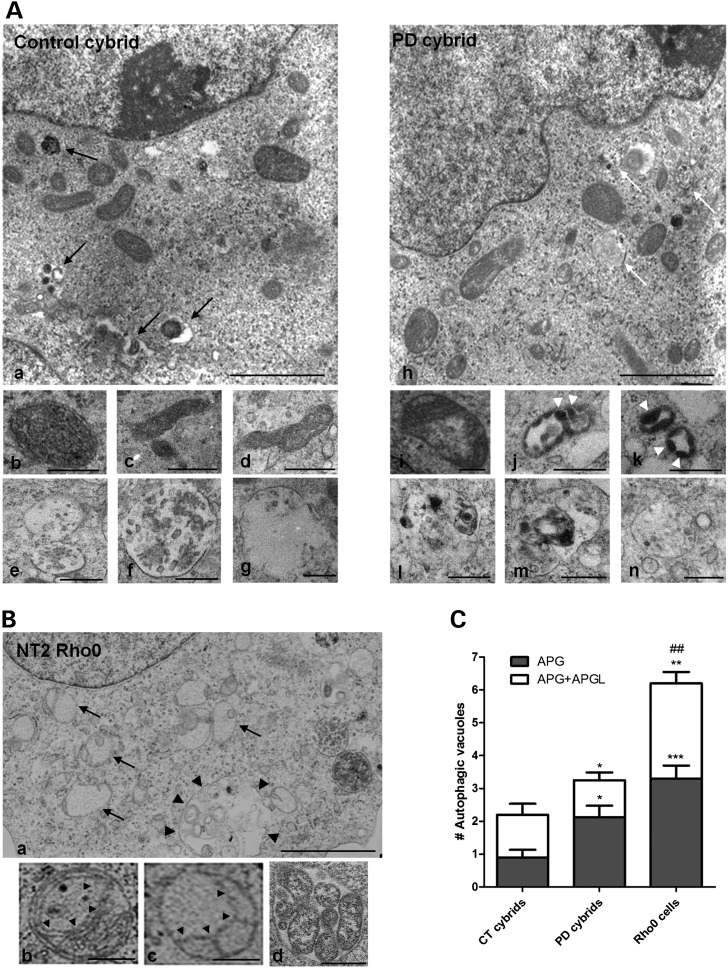
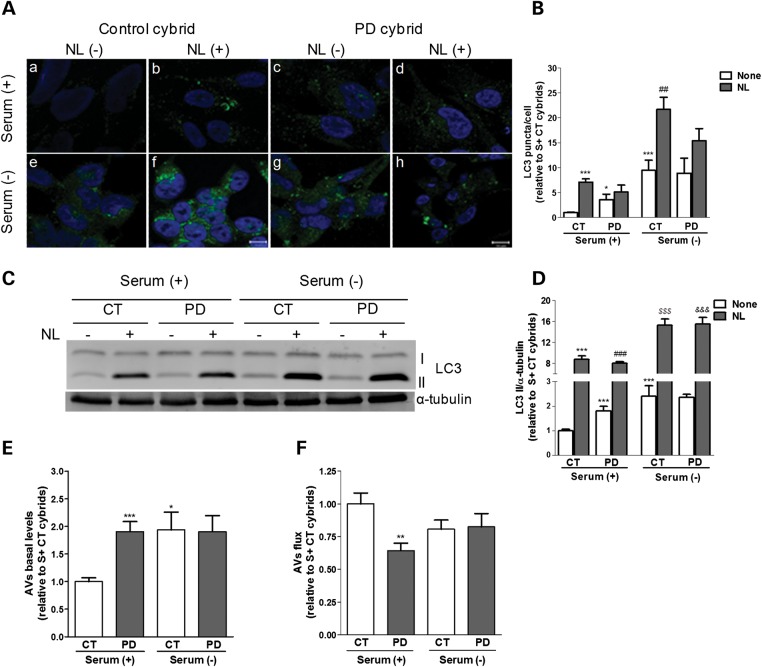
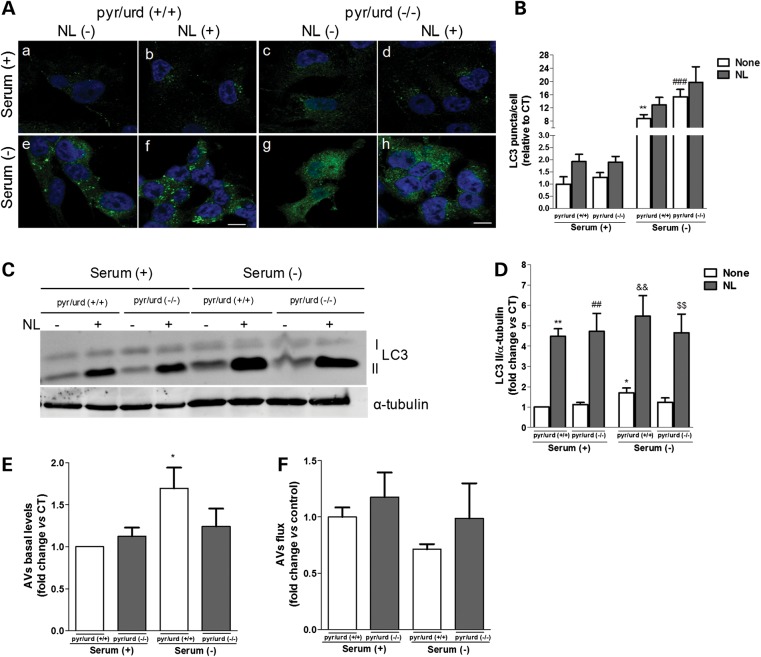
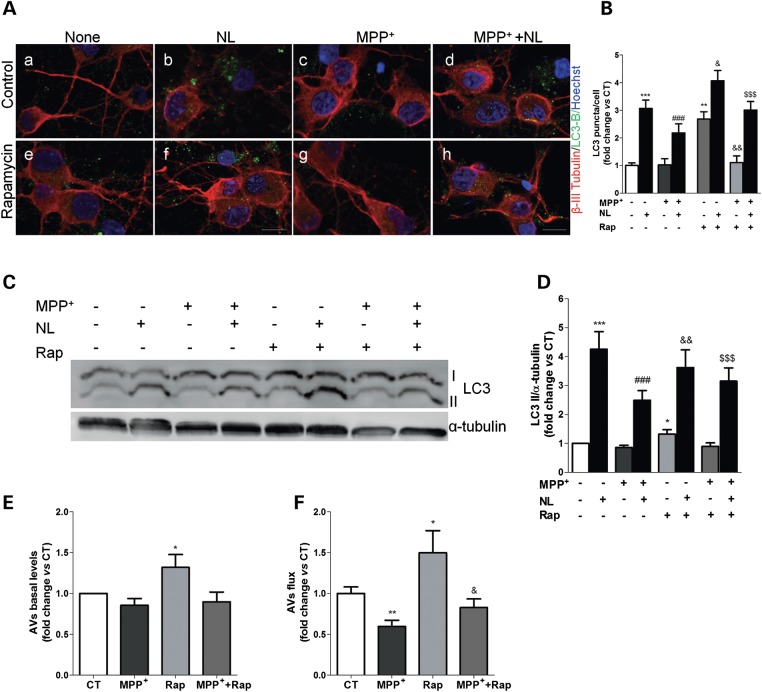
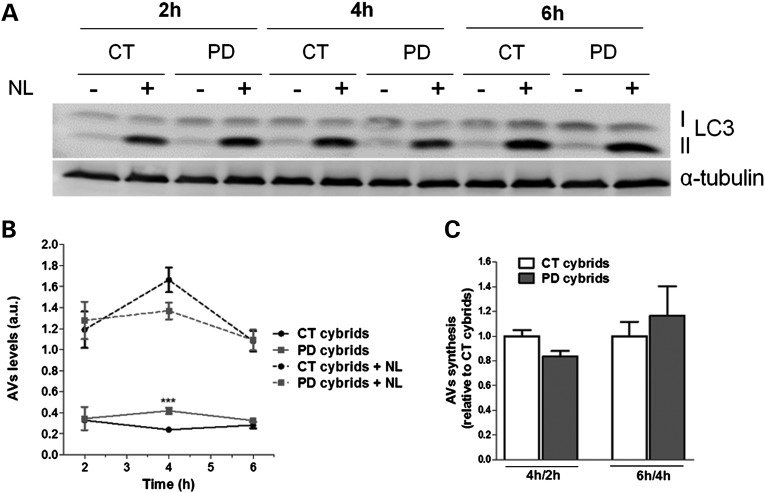
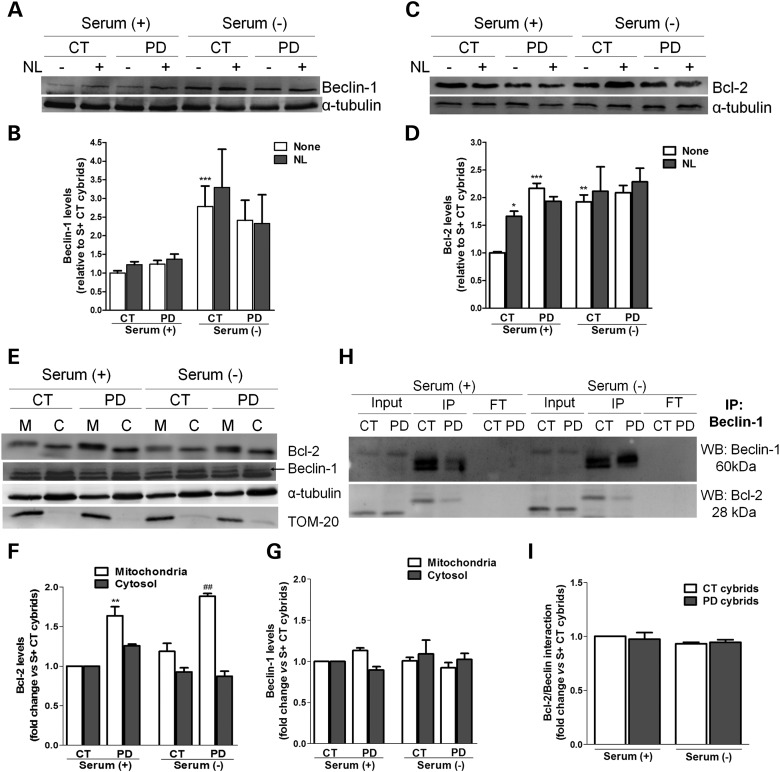
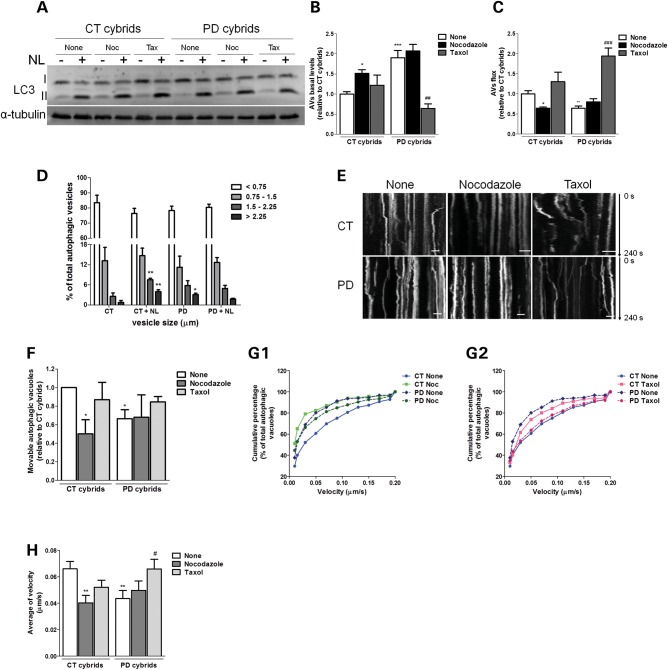
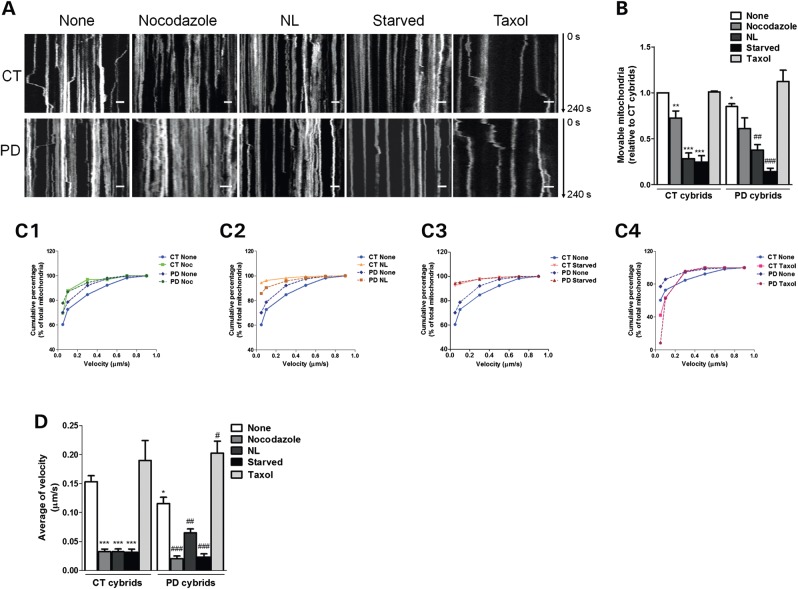
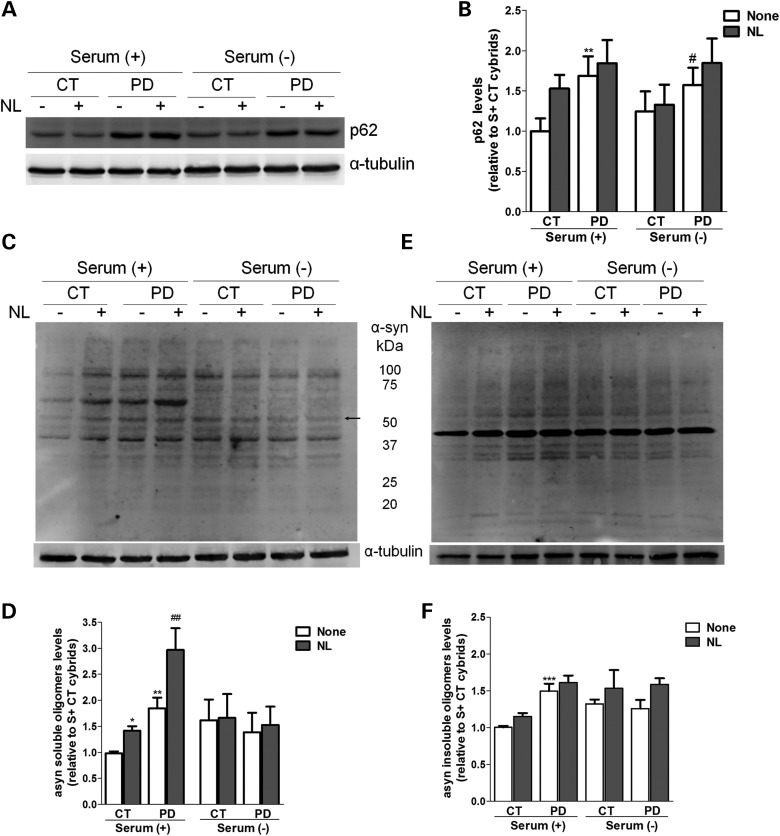
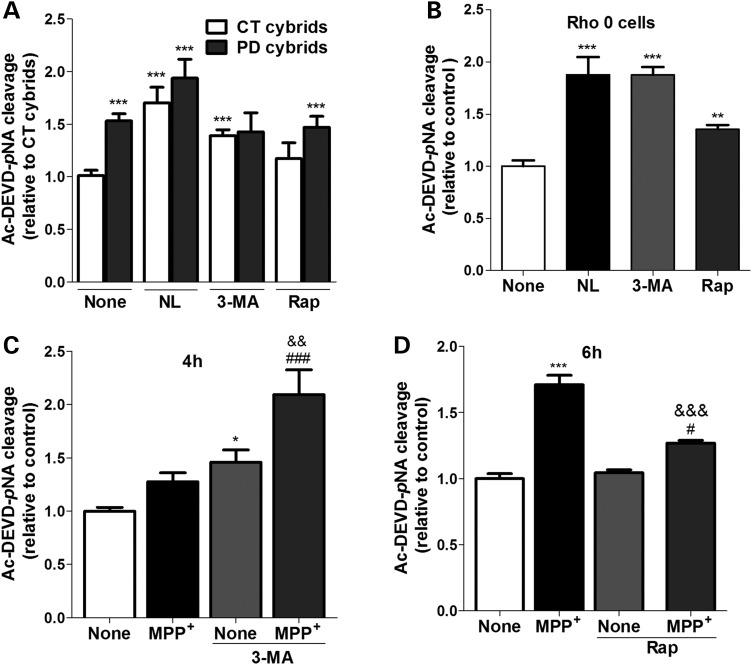
Abnormal presence of autophagic vacuoles is evident in brains of patients with Parkinson's disease (PD), in contrast to the rare detection of autophagosomes in a normal brain. However, the actual cause and pathological significance of these observations remain unknown. Here, we demonstrate a role for mitochondrial metabolism in the regulation of the autophagy-lysosomal pathway in ex vivo and in vitro models of PD. We show that transferring mitochondria from PD patients into cells previously depleted of mitochondrial DNA is sufficient to reproduce the alterations in the autophagic system observed in PD patient brains. Although the initial steps of this pathway are not compromised, there is an increased accumulation of autophagosomes associated with a defective autophagic activity. We prove that this functional decline was originated from a deficient mobilization of autophagosomes from their site of formation toward lysosomes due to disruption in microtubule-dependent trafficking. This contributed directly to a decreased proteolytic flux of α-synuclein and other autophagic substrates. Our results lend strong support for a direct impact of mitochondria in autophagy as defective autophagic clearance ability secondary to impaired microtubule trafficking is driven by dysfunctional mitochondria. We uncover mitochondria and mitochondria-dependent intracellular traffic as main players in the regulation of autophagy in PD.


Figures

Figure 1.
Figure 1.
Mitochondrial deficits are related with an altered ETC complex I activity. (A) Immunoblot for mitochondrial markers (Hsp60, VDAC/Porin, TOM20, COXIV) from CT and sPD cybrids. (B) Densitometric analysis of mitochondrial marker levels (n= 8, *P< 0.05, versus CT cybrids). (C) Mitochondrial respiratory chain complex I activity. Data are reported in nmol/min/mg as the mean ± SEM (n= 12; **P< 0.01, versus CT cybrids). (D) TOM20 immunostaining (green) of CT and sPD cybrids showing alterations in mitochondria distribution, elongation and interconnectivity in sPD cybrids. Hoechst 33342- stained nuclei are in blue (n= 3, ***P< 0.001, mitochondrial elongation sPD versus CT cybrids; *P< 0.05, mitochondrial interconnectivity sPD versus CT cybrids). Scale bar: 20 µm.
Figure 2.
Figure 2.
Mitochondrial deficits induced the accumulation of morphologically abnormal mitochondria and nonfused autophagic vacuoles. (A) Electron micrographs of CT and sPD cybrids. Lower inserts show higher magnification images to illustrate morphological features of mitochondria and individual examples of autophagic vacuoles in both CT and sPD cybrids. Black arrows, autophagolysosomes; white arrows, autophagosomes; arrows heads, electron-dense amorphous inclusions within mitochondria. Scale bars: 2 µm (top) and 0.5 µm (middle and bottom). (B) Electron micrographs of NT2 Rho0 cells. Higher magnification fields show morphological features of mitochondria and autophagic vacuoles in Rho0 cells. (a) Dark arrows: swollen pale mitochondria with discontinuous cristae; Dark arrow heads: enlarged autophagosome enclosing mitochondria and other materials; (b and c) dark arrow heads: abnormal membranous structures. Scale bars: 2 µm (top) and 0.5 µm (bottom). (C) Quantification of autophagosomes (APG) and autophagolysosomes (APGL) in cybrid cell lines and mtDNA-depleted (Rho0) cells. The total number of vesicles was quantified from 15 cell profiles for each cell line. (n= 3, *P< 0.05, ***P< 0.001, versus APG CT cybrids; *P< 0.05, **P< 0.01, versus APG+APGL CT cybrids; ##P< 0.01, versus APG+APGL sPD cybrids).
Figure 3.
Figure 3.
QC autophagic response is impaired in cells harboring sPD patient mitochondria. (A) LC3B immunostaining (green) of CT and sPD cybrids maintained in the presence [Serum (+)] or absence [Serum (−)] of serum and inhibitors of lysosomal proteolysis [NL (+); NL (−)]. Hoechst 33342-stained nuclei are in blue. (B) Mean number of LC3B-positive vesicles per cell profile (n= 3, *P< 0.05, ***P< 0.001 versus S+ CT cybrids; ##P< 0.01 versus S− CT cybrids). Scale bar: 10 µm. (C) Immunoblot for endogenous LC3B from CT and sPD cybrids after culture in serum (+) or serum (−) conditions and treatment with NL. (D) Densitometric analysis of endogenous levels of LC3B (n= 18, ***P< 0.001 versus S+ CT cybrids; ###P< 0.001 versus S+ sPD cybrids; $$$P< 0.001 versus S− CT cybrids; &&&P< 0.001 versus S− sPD cybrids). (E) Determination of autophagic vacuole (AV) levels. Values of LC3-II in the absence of NL represent the steady-state AV content (n= 18, *P< 0.05, ***P< 0.001 versus S+ CT cybrids). (F) Assessment of autophagic flux, calculated as the ratio of LC3-II densitometric value of NL-treated samples over the corresponding untreated samples (n= 18, **P< 0.01 versus S+ CT cybrids).
Figure 4.
Figure 4.
QC autophagic response is impaired in mtDNA-depleted cells. (A) LC3B immunostaining (green) of Rho0 cells maintained in serum (+) or serum (−) conditions and NL treatment, following growth in the presence [pyr/urd (+/+)] or absence [pyr/urd (−/−)] of pyruvate and uridine. Hoechst 33342-stained nuclei are in blue. (B) Mean number of LC3B-positive vesicles per cell profile [n= 3, **P< 0.01 versus S+ pyr/urd (+/+); ###P< 0.001 versus S− pyr/urd (+/+)]. Scale bar: 10 µm. (C) Immunoblot for endogenous LC3B from Rho0 cells maintained in serum (+) or serum (−) and NL treatment following growth in pyr/urd (+/+) or pyr/urd (−/−) conditions. (D) Densitometric analysis of LC3B endogenous levels [n= 5, *P< 0.05, **P< 0.01, versus S+ pyr/urd (+/+); ##P< 0.01, versus S+ pyr/urd (−/−); &&P< 0.01, versus S− pyr/urd (+/+); $$P< 0.01, versus S− pyr/urd (−/−)]. (E) Determination of autophagic vacuole (AV) levels [n= 5, *P< 0.05, versus S+ pyr/urd (+/+)]. (F) Assessment of autophagic flux (n= 5).
Figure 5.
Figure 5.
MPP+-induced mitochondrial dysfunction mediates autophagy-lysosome pathway impairments in primary cortical neurons. (A) LC3B immunostaining (green) of primary cortical neurons treated with MPP+ for 24 h. In the last 4 h, cells were co-treated with or without rapamycin and lysosomal inhibitors (NL). Beta-III-tubulin (red) and Hoechst 33342 (blue) co-staining were used as a neuronal and nuclei markers, respectively. Scale bar: 10 µm. (B) Mean number of LC3B-positive vesicles per cell profile (n= 3, **P< 0.01, ***P< 0.001, versus CT; ###P< 0.001, versus MPP+-treated cells; &P< 0.05, &&P< 0.01, versus rapamycin (Rap)-treated cells; $$$P< 0.001, versus Rap+MPP+-treated cells. (C) LC3B immunoblot of the same cells after MPP+ (24 h) or rapamycin (Rap, 4 h) treatment. (D) Densitometric analysis of LC3B endogenous levels (n= 13, *P< 0.05, ***P< 0.001, versus untreated cells; ###P< 0.001, versus MPP+-treated cells; &&P< 0.01, versus Rap-treated cells; $$$P< 0.001, versus Rap+MPP+-treated cells). (E) Determination of autophagic vacuole (AV) levels. Values of LC3-II in the absence of NL represent the steady-state AV content (n= 13, *P< 0.05, versus CT). (F) Assessment of autophagic flux, calculated as the ratio of LC3-II densitometric value of NL-treated samples over the corresponding untreated samples (n= 13, *P< 0.05, **P< 0.01, versus CT; &P< 0.05, versus Rap-treated cells).
Figure 6.
Figure 6.
AV synthesis is not primarily affected in sPD cybrid cells. (A) LC3B immunoblot for autophagosome synthesis assessment in CT and sPD cybrids treated with or without lysosomal inhibitors (NL) at three different time points (2, 4 and 6 h) (n =4). (B) Time course for autophagic vacuole (AV) levels. AV levels correspond to the densitometry values of LC3-II for each condition at each time point (n =4, ***P< 0.001, versus CT cybrids). (C) Assessment of autophagic synthesis. Rates of AV synthesis were determined by comparing LC3-II levels at two different time points after the addition of NL (4 versus 2 and 6 versus 4 h) (n =4).
Figure 7.
Figure 7.
Autophagic induction is not compromised in sPD cybrid cells. (A) Immunoblot for Beclin-1 from CT and sPD cybrids after culture in serum (+) or serum (−) conditions and treatment with or without NL. (B) Densitometric analysis of endogenous levels of Beclin-1 (n= 8, ***P< 0.001, versus S+ CT cybrids). (C) Immunoblot for Bcl-2 from CT and sPD cybrids after culture in serum (+) or serum (−) conditions and treatment with NL. (D) Densitometric analysis of endogenous levels of Bcl-2 (n= 6, *P< 0.05, **P< 0.01, ***P< 0.001, versus S+ CT cybrids). (E) Representative immunoblots for Bcl-2 and Beclin-1 cellular subcompartmentalization in mitochondria (M)- and cytosol (C)-enriched fractions. (F) and (G) Densitometric analysis of the levels of Bcl-2 (F) (n= 3, **P< 0.01, versus S+ CT cybrids; ##P< 0.01, versus S− CT cybrids) and Beclin-1 (G) (n= 3). (H) Co-immunoprecipitation of Beclin-1 and Bcl-2 in CT and sPD cybrids maintained in serum (+) or serum (−) conditions. Levels of Beclin-1 (top) and Bcl-2 (bottom) in the input, immunoprecipitate (IP) and flow through (FT) are shown. (I) Determination Bcl-2/Beclin-1 physical interaction (n= 3).
Figure 8.
Figure 8.
Disruption of microtubule network results in a deficient autophagic turnover and reduced autophagic vesicle movements in sPD cybrid cells. (A) Immunoblot for endogenous LC3B from CT and sPD cybrids after treatment with taxol (Tax) or nocodazole (Noc) for 24 h. In the last 4 h, cells were co-treated with or without lysosomal inhibitors (NL). (B) Determination of autophagic vacuole (AV) levels. Values of LC3-II in the absence of NL represent the steady-state AV content (n= 4, *P< 0.05, ***P< 0.001, versus CT cybrids; ##P< 0.01 versus sPD cybrids). (C) Assessment of autophagic flux, determined as the ratio of LC3-II densitometric value of NL-treated samples over the corresponding untreated samples (n= 4, *P< 0.05, **P< 0.01, versus CT cybrids; ###P< 0.001 versus sPD cybrids). (D) Accumulation of AVs in CT and sPD cybrid cells. LC3B immunostaining was used to determine AV size distribution from CT and sPD cybrids after treatment with or without lysosomal inhibitors (NL). AV size distribution was graphed as percent of total vacuoles within the indicated size ranges (n= 4, *P< 0.05, **P< 0.001, versus CT cybrids). (E) Representative kymograph images (out of three experiments) of AV movement in CT and sPD cybrid cells treated with nocodazole (24 h) or taxol (24 h). Scale bars: 5 µm. (F) Number of movable AVs when compared with those of total AVs (n= 3, *P< 0.05, versus CT cybrids). (G1 and 2). Cumulative data for AV transport velocity in CT and sPD cybrid cells treated with Noc (G1) or treated with taxol (G2) (n= 3). (H) Average transport velocity of AVs (μm/s) (n= 3, **P< 0.01, versus CT cybrids; #P< 0.05, versus sPD cybrids).
Figure 9.
Figure 9.
Disruption of microtubule network results in reduced mitochondrial movements in sPD cybrid cells. (A) Representative kymograph images (out of three experiments) of mitochondrial movement in CT and sPD cybrid cells treated with nocodazole (24 h), taxol (24 h) and lysosomal inhibitors (NL, 4 h) or subjected to starvation (starved, 6 h). Scale bars: 5 µm. (B) Number of movable mitochondria when compared with those of total mitochondria (n= 3, *P< 0.05, **P< 0.01, ***P< 0.001, versus CT cybrids; ##P< 0.01, ###P< 0.001, versus sPD cybrids). (C1–4) Cumulative data for mitochondrial transport velocity in CT and sPD cybrid cells treated with Noc (C1), NL (C2), subjected to starvation (C3) or treated with taxol (C4) (n= 3). (D) Average transport velocity of mitochondria (μm/s) (n= 3, *P< 0.05, ***P< 0.001, versus CT cybrids; #P< 0.05,##P< 0.01,###P< 0.001, versus sPD cybrids).
Figure 10.
Figure 10.
α-Synuclein and p62 degradation by autophagy is impaired in cells harboring mitochondrial dysfunction. (A) Immunoblot for p62 from CT and sPD cybrid cells cultured in S+ or S− conditions and treated with or without lysosomal inhibitors (NL). (B) Densitometric analysis of p62 levels (n= 6, **P< 0.01 versus S+ CT cybrids; #P< 0.05, versus S− CT cybrids). (C and E) Immunoblots for α-synuclein oligomeric forms from CT and sPD cybrid cells cultured in S+ or S− conditions and treated with or without lysosomal inhibitors (NL). Representative blots of Triton X-100-soluble oligomeric species (C) and Triton X-100-insoluble, SDS-resistant oligomeric species (E). The arrow indicates band of tetrameric form of α-synuclein. (D and F) Densitometric analysis of α-synuclein-soluble oligomers content (D) (n= 12, *P< 0.05, **P< 0.01, versus S+ CT cybrids; ##P< 0.01, versus S+ sPD cybrids) and α-synuclein-insoluble oligomers content (F) (n= 12, ***P< 0.001, versus S+ CT cybrids).
Figure 11.
Figure 11.
Impaired autophagic turnover triggers caspase-3 over-activation in cells harboring mitochondrial deficits. Caspase-3 activation was addressed by Ac-DEVD-pNA cleavage in CT and sPD cybrids (A) (n= 12; ***P< 0.001, versus CT cybrids); NT2 Rho0 cells (B) (n= 5; **P< 0.01, ***P< 0.001, versus untreated Rho0 cells) treated with or without lysosomal inhibitors (NL), 3-MA or rapamycin (Rap) for 4 h; and in MPP+-treated NT2 Rho+ cells treated with or without 3-MA for 4 h (C) (n= 6–8; *P< 0.001, versus untreated cells; ###P< 0.001, versus MPP+-treated cells; &&P< 0.01, versus 3-MA-treated cells) or Rap for 6 h (D) as indicated (n= 6–8; ***P< 0.001, versus untreated cells; #P< 0.01, versus Rap-treated cells; &&&P< 0.001, versus MPP+-treated cells).

Similar articles

Cited by

References

    1. Forno L.S. Neuropathology of Parkinson's disease. J. Neuropathol. Exp. Neurol. 1996;55:259–272. - PubMed
    1. Schapira A.H., Cooper J.M., Dexter D., Jenner P., Clark J.B., Marsden C.D. Mitochondrial complex I deficiency in Parkinson's disease. Lancet. 1989;1:1269. - PubMed
    1. Parker W.D., Jr, Boyson S.J., Parks J.K. Abnormalities of the electron transport chain in idiopathic Parkinson's disease. Ann. Neurol. 1989;26:719–723. - PubMed
    1. Swerdlow R.H., Parks J.K., Miller S.W., Tuttle J.B., Trimmer P.A., Sheehan J.P., Bennett J.P., Jr, Davis R.E., Parker W.D., Jr Origin and functional consequences of the complex I defect in Parkinson's disease. Ann. Neurol. 1996;40:663–671. - PubMed
    1. Swerdlow R.H. Does mitochondrial DNA play a role in Parkinson's disease? A review of cybrid and other supportive evidence. Antioxid. Redox Signal. 2012;16:950–964. - PMC - PubMed

Publication types

MeSH terms