Comparative Study
. 2012 Nov;67(11):1178-87.
doi: 10.1093/gerona/gls146. Epub 2012 Jul 25.

Moderate intensity, but not high intensity, treadmill exercise training alters power output properties in myocardium from aged rats

Affiliations
Comparative Study

Moderate intensity, but not high intensity, treadmill exercise training alters power output properties in myocardium from aged rats

Eunhee Chung et al. J Gerontol A Biol Sci Med Sci. 2012 Nov.

Abstract

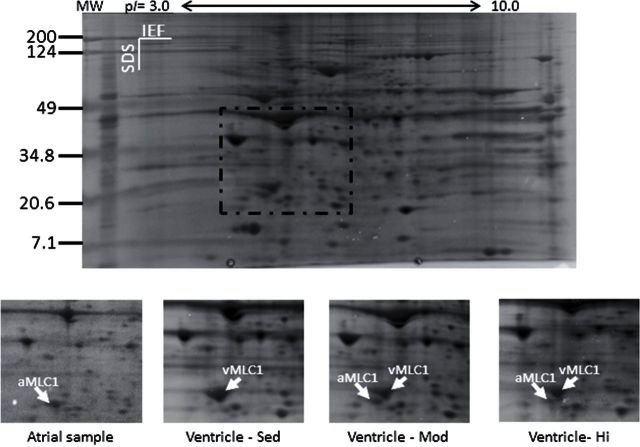
Aging is characterized by a progressive decline in cardiac function, but endurance exercise training has been shown to retard a number of deleterious effects of aging. However, underlying mechanisms by which exercise training improves age-related decrements in myocardial contractile function are not well understood. The purpose of this study was to determine the effects of exercise training on power output properties in permeablized (skinned) myocytes of old rats. Thirty-month-old rats were divided into sedentary control (C) and groups undergoing 11 weeks of treadmill exercise training at moderate intensity (MI) and at high intensity (HI). Peak power output normalized to maximal force was significantly increased in MI but not in HI compared to C with significant increases in atrial myosin light chain 1 in ventricle. These results suggest that MI exercise training is beneficial as a significant increase was seen in the ability of the myocardium to do work, but this effect was not seen with HI training.


Figures

Figure 1.
Figure 1.
Force (A) and length (B) traces from three force-clamp experiments in a representative myocyte. After steady tension had developed in maximally activating solution (pCa 4.5), the servomotor was switched to force-control mode, and the force was stepped down to a preselected value, in this example, maximum isometric forces of 0.8, 0.5, and 0.3 of P o. Length changes during isotonic shortening at each load were fit by using linear regression, with the slope of the line taken as the velocity of shortening for that load. (C) Force–velocity curve in a single myocyte resulting from force-clamp experiments illustrated in A and B. A total of nine force-clamp measurements were done for this myocytes (•). Force and velocity data during the clamp were plotted and then these points were fit to the Hill equation (line).
Figure 2.
Figure 2.
(A) Composite force–velocity curves from control (C), moderate-intensity (MI), and high-intensity (HI) myocytes. Data were compiled from 45 C, 51 MI, and 49 HI myocytes. Isotonic shortening velocity values at each load were averaged from all myocytes in each group. Data points indicate mean and error bars indicates standard errors of means for velocity. • and dashed line = C; o and solid line = MI, ▲ and and dotted line = HI. Lines are the best-fit regression line using the Hill equation as described in the Methods section.(B) Composite force–power curve constructed from force–velocity data. In each myocytes at each load, force values (expressed as P/P o) were multiplied times mean velocity values (expressed ML/s) to result in a value of power output for that load. Lines are the best-fit regression line using the Hill equation as described in the Methods section. Peak power output was taken from the highest point in the best-fit line. • and dashed line = C; o and solid line = MI, and ▲ and dotted line = HI.
Figure 3.
Figure 3.
(A) Representative 6% sodium dodecyl sulfate–polyacrylamide gels showing the distribution of myosin heavy-chain (MHC) isoforms in ventricular homogenates from control (C), moderate-intensity (MI), and high-intensity (HI) rats. Lane 1 is from C, lane 2 is from HI, and lane 3 is MI. There is no significant difference among groups. (B) Bar graph represents mean with standard errors of means of the percent -MHC in ventricular homogenates from C, MI, and HI rats.
Figure 4.
Figure 4.
Results of two-dimensional electrophoresis analysis of aMLC1 protein expression in trained and control ventricular tissue. (A) Whole-gel results of first-dimension isoelectric focusing using a pH 3–10 gradient and second-dimension sodium dodecyl sulfate–polyacrylamide gel electrophoresis with a 12.5% acrylamide gel. (B) Close-up of the aMLC1/vMLC1 region of gels (box in A) used for analysis. Shown are representative gels using homogenates from control atrial tissue, ventricular tissue from control (C), moderate-intensity (MI), and high-intensity (HI) animals. Identification of aMLC1 and vMLC1 is based on predicted isoelectric point and molecular weight values for these proteins as well as previously published two-dimensional electrophoretic analyses of these proteins.

Similar articles

Cited by

References

    1. Renlund DG, Gerstenblith G. Exercise and the aging heart Cardiol Clin 1987;5(2):331 336 - PubMed
    1. Shephard RJ, Balady GJ. Exercise as cardiovascular therapy Circulation 1999;99(7):963 972 - PubMed
    1. Brenner DA, Apstein CS, Saupe KW. Exercise training attenuates age-associated diastolic dysfunction in rats Circulation 2001;104(2):221 226 - PubMed
    1. Taffet GE, Michael LA, Tate CA. Exercise training improves lusitropy by isoproterenol in papillary muscles from aged rats J Appl Physiol. 1996;81(4):1488 1494 - PubMed
    1. Tate CA, Taffet GE, Hudson EK, Blaylock SL, McBride RP, Michael LH. Enhanced calcium uptake of cardiac sarcoplasmic reticulum in exercise-trained old rats Am J Physiol Heart Circ Physiol. 1990;258(2):H431 H435 - PubMed

Publication types

Substances