. 2012 Sep 21;287(39):32394-405.
doi: 10.1074/jbc.M112.393900. Epub 2012 Jul 25.

Migfilin protein promotes migration and invasion in human glioma through epidermal growth factor receptor-mediated phospholipase C-γ and STAT3 protein signaling pathways

Affiliations

Migfilin protein promotes migration and invasion in human glioma through epidermal growth factor receptor-mediated phospholipase C-γ and STAT3 protein signaling pathways

Yunwei Ou et al. J Biol Chem. .

Erratum in

  • J Biol Chem. 2013 Apr 12;288(15):10948

Abstract

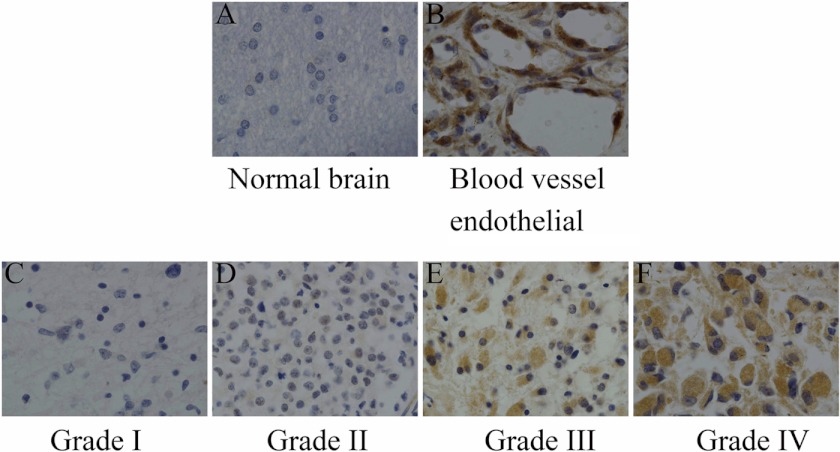
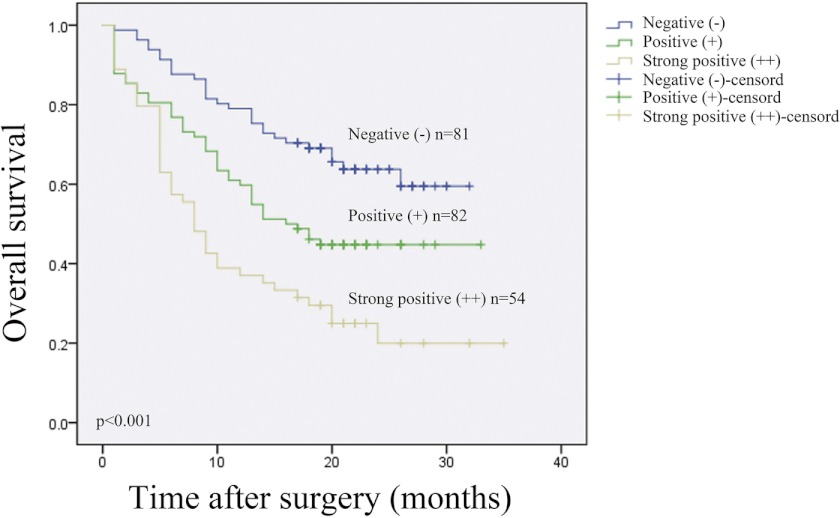
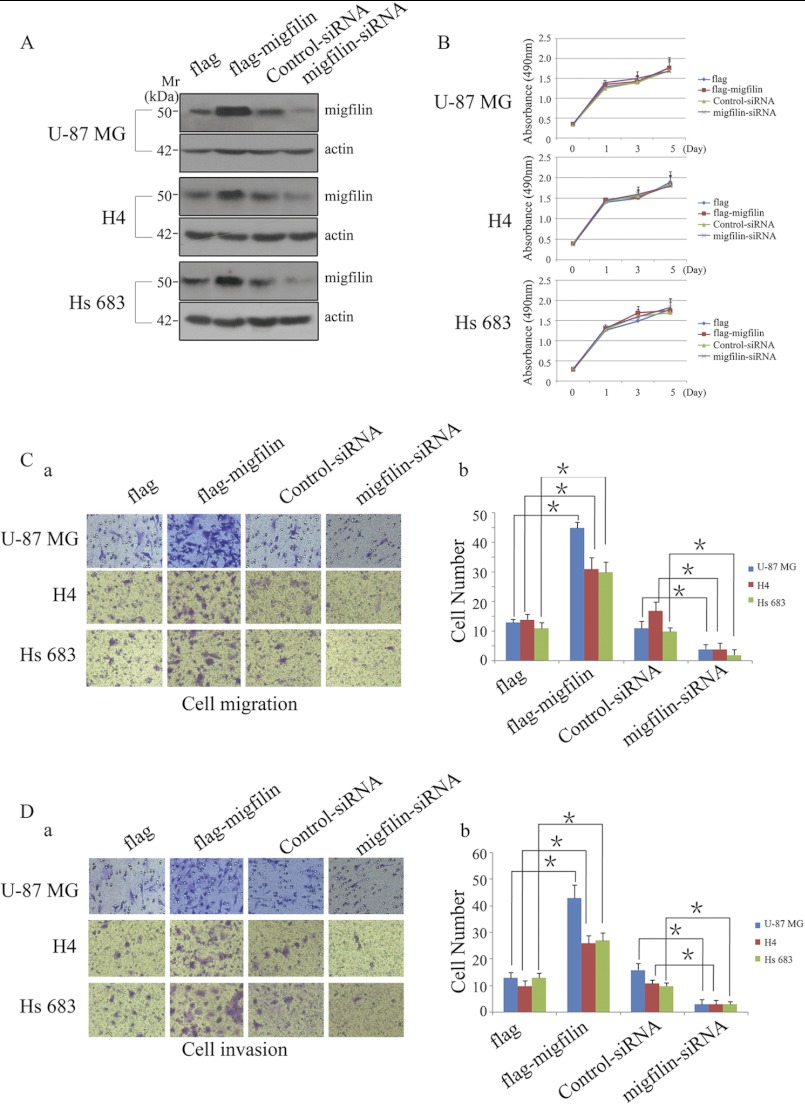
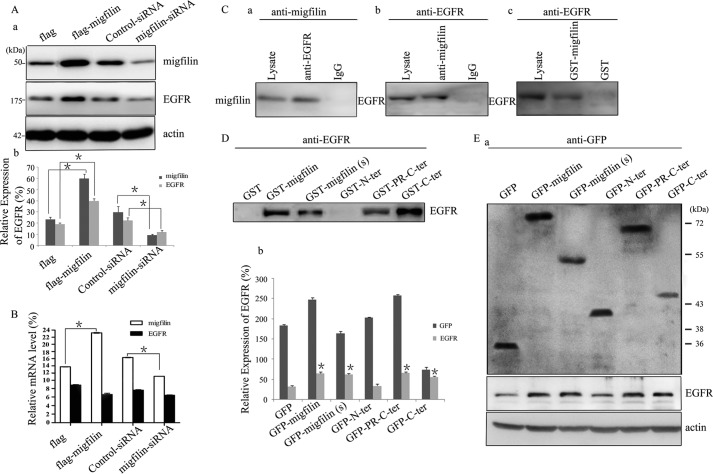
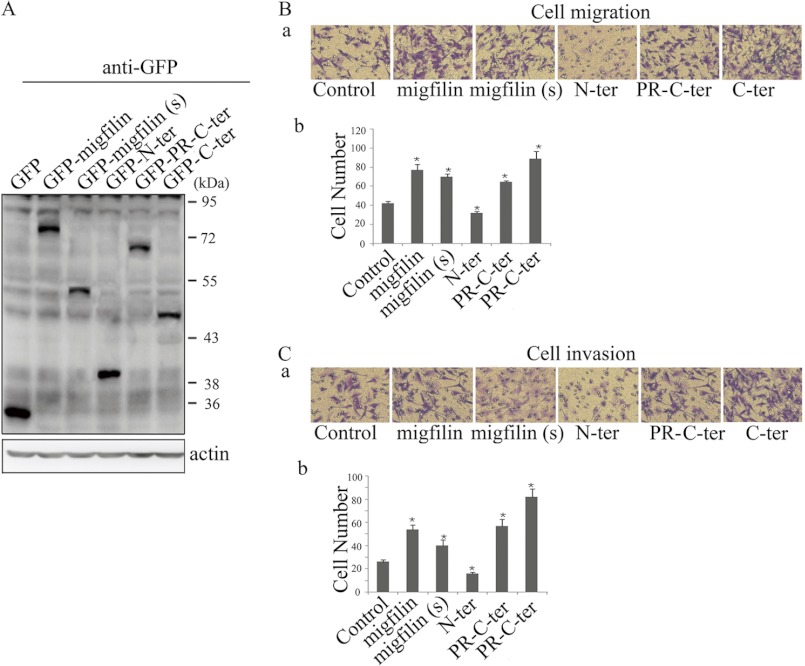
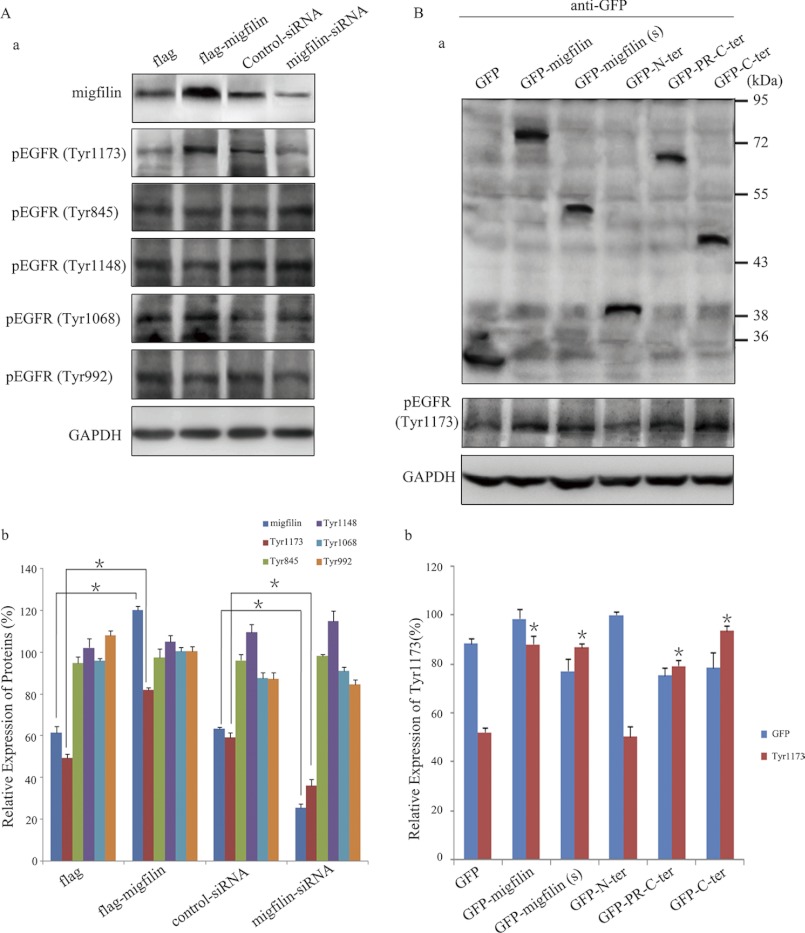
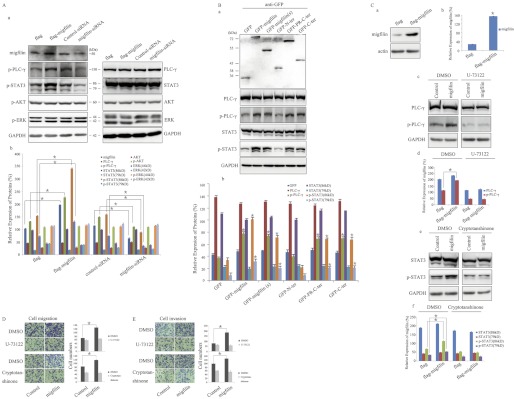
Migfilin is critical for cell shape and motile regulation. However, its pathological role in glioma is unknown. Using an immunohistochemical staining assay, we demonstrate that there is a significant correlation between expression of Migfilin and pathological tumor grade in 217 clinical glioma samples. High Migfilin expression is associated with poor prognosis for patients with glioma. Investigation of the molecular mechanism shows that Migfilin promotes migration and invasion in glioma cells. Moreover, Migfilin positively modulates the expression and activity of epidermal growth factor receptor, and Migfilin-mediated migration and invasion depend on epidermal growth factor receptor-induced PLC-γ and STAT3-signaling pathways. Our results may provide significant clinical application, including use of Migfilin as a molecular marker in glioma for early diagnosis and as an indicator of prognosis.


Figures

FIGURE 1.
FIGURE 1.
Expression of Migfilin in normal brain tissue and glioma tissue (×400). A, normal brain cells exhibit no immunoreactivity for Migfilin. B, high levels of Migfilin were detected in blood vessel endothelial cells. C and D, Migfilin exhibits weak immunoreactivity in grade I and grade II gliomas. E, Migfilin exhibits moderate immunoreactivity in grade III glioma. F, Migfilin exhibits strong immunoreactivity in grade IV glioma.
FIGURE 2.
FIGURE 2.
Kaplan-Meier curves with univariate analyses (log-rank) for patients with negative Migfilin expression (blue line, n = 81), positive Migfilin expression (green line, n = 82), and strong Migfilin expression tumors (brown line, n = 54).
FIGURE 3.
FIGURE 3.
Migfilin could not induce glioma cell proliferation but could modulate the migrative and invasive ability of glioma cells in vitro. A, ectopic expression and knockdown of Migfilin in glioma cell lines U-87 MG, H4, and Hs 683 were analyzed by Western blotting using an anti-Migfilin antibody. B, growth curves reveal that Migfilin could not induce glioma cells proliferation. C and D, representative pictures (panel a) and quantification (panel b) of penetrated cells were analyzed using the Transwell migrative or invasive assay. The quantification of penetrated cells was represented as the mean of three different experiments. *, p < 0.05 versus FLAG or Control-siRNA.
FIGURE 4.
FIGURE 4.
Migfilin up-regulates the expression of EGFR and forms a complex with EGFR in glioma cells. A, panel a, expression of EGFR was analyzed by Western blotting in Migfilin-transfected and Migfilin siRNA-transfected cells. Protein expression levels were normalized with actin. A, panel b, bar chart shows the relative expression of EGFR. Protein quantification was obtained by densitometric analysis of the protein absorbance × resulting band area. Protein quantified was relative to the actin internal control. All experiments were performed at least three times with consistent and repeatable results. Each value is expressed as mean ± S.D. (n = 3). *, p < 0.05 versus FLAG or Control-siRNA. B, quantification of changes of EGFR mRNA levels in Migfilin-transfected and Migfilin siRNA-transfected cells. mRNA expression levels were normalized with GAPDH. *, p < 0.05 versus FLAG or Control-siRNA. C, panels a and b, immunoprecipitation of Migfilin and EGFR. Lysates of human U-87 MG cells were mixed with rabbit anti-EGFR antibody (panel a) or mouse anti-Migfilin mAb (panel b). The immunoprecipitates or the control precipitates were analyzed by Western blotting with anti-Migfilin and EGFR antibodies, respectively. Panel c, GST fusion protein pulldown assay. Human U-87 MG cell lysates were incubated with GST-Migfilin fusion protein or GST. GST-Migfilin and GST were precipitated with glutathione beads. EGFR was detected by Western blotting with an anti-EGFR mAb. D, GST fusion protein pulldown assay. Human U-87 MG cell lysates were incubated with GST-Migfilin mutant fusion proteins or GST. GST-Migfilin mutant fusion proteins and GST were precipitated with glutathione beads. EGFR was detected by Western blotting with an anti-EGFR mAb. E, panel a, ectopic expression of mutant Migfilin in U-87 MG cells lines was analyzed by Western blotting using an anti-GFP antibody; The expression of EGFR was analyzed by Western blotting in U-87 MG cells transfected Migfilin mutant plasmids. Protein expression levels were normalized with actin; panel b, bar chart shows the relative expression of GFP and EGFR. Protein quantification was obtained by densitometric analysis of the protein absorbance × resulting band area. Protein quantified was relative to the actin internal control. All experiments were performed at least three times with consistent and repeatable results. Each value is expressed as mean ± S.D. (n = 3). *, p < 0.05 versus GFP.
FIGURE 5.
FIGURE 5.
C-terminal region is required for Migfilin modulation of migration and invasion in glioma cells. A, ectopic expression of mutant Migfilin in glioma cells lines U-87 MG was analyzed by Western blotting using an anti-GFP antibody. B and C, representative pictures (panel a) and quantification (panel b) of penetrated cells were analyzed using the Transwell migrative or invasive assay. The quantification of penetrated cells was represented as the mean of three different experiments. *, p < 0.05 versus control.
FIGURE 6.
FIGURE 6.
C-terminal region is essential for Migfilin regulation of the EGFR phosphorylation. A, panel a, endogenous phosphorylation of EGFR was analyzed by Western blotting using anti-pEGFR antibodies in Migfilin-transfected and Migfilin siRNA-transfected cells. Protein expression levels were normalized with GAPDH; A, panel b, bar chart shows the relative expression of proteins. *, p < 0.05 versus FLAG or control-siRNA. B, panel a, ectopic expression of mutant Migfilin in U-87 MG cells lines was analyzed by Western blotting using an anti-GFP antibody (top panel). The expression of Tyr-1173 phosphorylation of EGFR was analyzed by Western blotting in U-87 MG cells transfected with Migfilin mutant plasmids (bottom panel). Protein expression levels were normalized with GAPDH; B, panel b, bar chart shows the relative expression of proteins. Protein quantification was obtained by densitometric analysis of the protein absorbance × resulting band area. Protein quantified was relative to the GAPDH internal control. All experiments were performed at least three times with consistent and repeatable results. Each value is expressed as mean ± S.D. (n = 3). *, p < 0.05 versus GFP.
FIGURE 7.
FIGURE 7.
C-terminal region is essential for Migfilin regulation of EGFR-mediated PLC-γ and STAT3-signaling pathways in glioma cells. A, panel a, Western blotting analysis of endogenous ERK, PLC-γ1, STAT3, and AKT in Migfilin-transfected and Migfilin siRNA-transfected cells. Protein expression levels were normalized with GAPDH; A, panel b, bar chart shows the relative expression of proteins. *, p < 0.05 versus FLAG or control-siRNA. B, panel a, ectopic expression of mutant Migfilin in U-87 MG cells lines was analyzed by Western blotting using an anti-GFP antibody (top panel). The expression of PLC-γ1, p-PLC-γ1, STAT3, and p-STAT3 were analyzed by Western blotting in U-87 MG cells transfected with Migfilin mutant plasmids (bottom panel). Protein expression levels were normalized with GAPDH. B, panel b, bar chart shows the relative expression of proteins. *, p < 0.05 versus GFP. C, inhibitor of PLC-γ (U-73122) reduces the Migfilin-induced phosphorylation of PLC-γ, whereas inhibitor of STAT3 (cryptotanshinone) reduces the Migfilin-induced phosphorylation of STAT3. Migfilin-transfected cells were incubated with U-73122 (2 μmol/liter) for 30 min or cryptotanshinone (5 μmol/liter) for 24 h. Panels a, c, and e, Western blotting analysis of Migfilin, PLC-γ1, p-PLC-γ1, STAT3, and p-STAT3; and panels b, d, and f, bar chart shows the relative expression of proteins, and proteins expression levels were normalized with actin or GAPDH. Protein quantification was obtained by densitometric analysis of the protein absorbance × resulting band area. Protein quantified was relative to the actin or GAPDH internal control. All experiments were performed at least three times with consistent and repeatable results. Each value is expressed as mean ± S.D. (n = 3). *, p < 0.05 versus FLAG. D and E, effects of U-73122 and cryptotanshinone on Migfilin-mediated migration and invasion in glioma cells. Migfilin-transfected cells were incubated with U-73122 (2 μmol/liter) for 30 min or cryptotanshinone (5 μmol/liter) for 24 h. Representative pictures (left panel) and quantification (right panel) of penetrated cells were analyzed using the Transwell migrative or invasive assay. The quantification of penetrated cells was represented as the mean of three different experiments. *, p < 0.05 versus control.

Similar articles

Cited by

References

    1. Furnari F. B., Fenton T., Bachoo R. M., Mukasa A., Stommel J. M., Stegh A., Hahn W. C., Ligon K. L., Louis D. N., Brennan C., Chin L., DePinho R. A., Cavenee W. K. (2007) Malignant astrocytic glioma. Genetics, biology, and paths to treatment. Genes Dev. 21, 2683–2710 - PubMed
    1. Louis D. N., Ohgaki H., Wiestler O. D., Cavenee W. K., Burger P. C., Jouvet A., Scheithauer B. W., Kleihues P. (2007) The 2007 WHO classification of tumors of the central nervous system. Acta Neuropathol. 114, 97–109 - PMC - PubMed
    1. Wick W., Platten M., Weller M. (2009) New (alternative) temozolomide regimens for the treatment of glioma. Neuro. Oncol. 11, 69–79 - PMC - PubMed
    1. Yang L., Ng K. Y., Lillehei K. O. (2003) Cell-mediated immunotherapy. A new approach to the treatment of malignant glioma. Cancer Control 10, 138–147 - PubMed
    1. Stewart L. A. (2002) Chemotherapy in adult high grade glioma. A systematic review and meta-analysis of individual patient data from 12 randomized trials. Lancet 359, 1011–1018 - PubMed

Publication types

MeSH terms