

Heme oxygenase-1 promotes survival of renal cancer cells through modulation of apoptosis- and autophagy-regulating molecules
- PMID: 22843690
- PMCID: PMC3442542
- DOI: 10.1074/jbc.M112.393140
Heme oxygenase-1 promotes survival of renal cancer cells through modulation of apoptosis- and autophagy-regulating molecules
Abstract
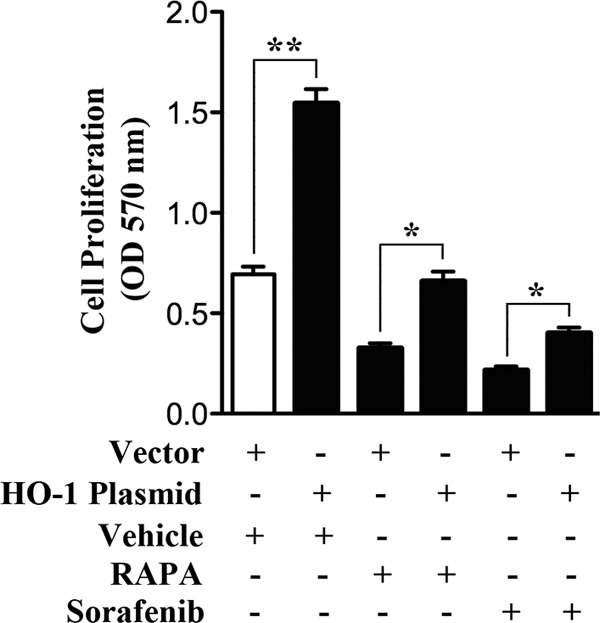
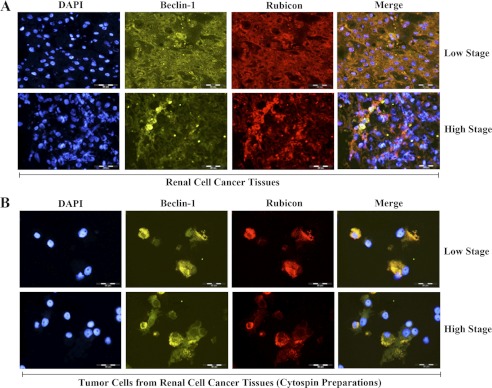
The cytoprotective enzyme heme oxygenase-1 (HO-1) is often overexpressed in different types of cancers and promotes cancer progression. We have recently shown that the Ras-Raf-ERK pathway induces HO-1 to promote survival of renal cancer cells. Here, we examined the possible mechanisms underlying HO-1-mediated cell survival. Considering the growing evidence about the significance of apoptosis and autophagy in cancer, we tried to investigate how HO-1 controls these events to regulate survival of cancer cells. Rapamycin (RAPA) and sorafenib, two commonly used drugs for renal cancer treatment, were found to induce HO-1 expression in renal cancer cells Caki-1 and 786-O; and the apoptotic effect of these drugs was markedly enhanced upon HO-1 knockdown. Overexpression of HO-1 protected the cells from RAPA- and sorafenib-induced apoptosis and also averted drug-mediated inhibition of cell proliferation. HO-1 induced the expression of anti-apoptotic Bcl-xL and decreased the expression of autophagic proteins Beclin-1 and LC3B-II; while knockdown of HO-1 down-regulated Bcl-xL and markedly increased LC3B-II. Moreover, HO-1 promoted the association of Beclin-1 with Bcl-xL and Rubicon, a novel negative regulator of autophagy. Drug-induced dissociation of Beclin-1 from Rubicon and the induction of autophagy were also inhibited by HO-1. Together, our data signify that HO-1 is up-regulated in renal cancer cells as a survival strategy against chemotherapeutic drugs and promotes growth of tumor cells by inhibiting both apoptosis and autophagy. Thus, application of chemotherapeutic drugs along with HO-1 inhibitor may elevate therapeutic efficiency by reducing the cytoprotective effects of HO-1 and by simultaneous induction of both apoptosis and autophagy.
Figures


Similar articles
-
The heme oxygenase-1 protein is overexpressed in human renal cancer cells following activation of the Ras-Raf-ERK pathway and mediates anti-apoptotic signal.J Biol Chem. 2011 Sep 23;286(38):33580-90. doi: 10.1074/jbc.M111.248401. Epub 2011 Jul 31. J Biol Chem. 2011. PMID: 21808062 Free PMC article.
-
Autophagic proteins regulate cigarette smoke-induced apoptosis: protective role of heme oxygenase-1.Autophagy. 2008 Oct;4(7):887-95. doi: 10.4161/auto.6767. Epub 2008 Oct 12. Autophagy. 2008. Retraction in: Autophagy. 2024 May 2:1. doi: 10.1080/15548627.2024.2343270. PMID: 18769149 Retracted.
-
Novel roles of c-Met in the survival of renal cancer cells through the regulation of HO-1 and PD-L1 expression.J Biol Chem. 2015 Mar 27;290(13):8110-20. doi: 10.1074/jbc.M114.612689. Epub 2015 Feb 2. J Biol Chem. 2015. PMID: 25645920 Free PMC article.
-
Heme oxygenase-1 enhances autophagy in podocytes as a protective mechanism against high glucose-induced apoptosis.Exp Cell Res. 2015 Oct 1;337(2):146-59. doi: 10.1016/j.yexcr.2015.04.005. Epub 2015 Apr 13. Exp Cell Res. 2015. PMID: 25882498 Review.
-
Heme Oxgenase-1, a Cardinal Modulator of Regulated Cell Death and Inflammation.Cells. 2021 Feb 28;10(3):515. doi: 10.3390/cells10030515. Cells. 2021. PMID: 33671004 Free PMC article. Review.
Cited by
-
Src/STAT3-dependent heme oxygenase-1 induction mediates chemoresistance of breast cancer cells to doxorubicin by promoting autophagy.Cancer Sci. 2015 Aug;106(8):1023-32. doi: 10.1111/cas.12712. Epub 2015 Jul 4. Cancer Sci. 2015. PMID: 26041409 Free PMC article.
-
CYLD-mediated signaling and diseases.Curr Drug Targets. 2015;16(4):284-94. doi: 10.2174/1389450115666141024152421. Curr Drug Targets. 2015. PMID: 25342597 Free PMC article. Review.
-
Expression of methionine adenosyltransferase 2A in renal cell carcinomas and potential mechanism for kidney carcinogenesis.BMC Cancer. 2014 Mar 17;14:196. doi: 10.1186/1471-2407-14-196. BMC Cancer. 2014. PMID: 24636201 Free PMC article.
-
The dual role and mutual dependence of heme/HO-1/Bach1 axis in the carcinogenic and anti-carcinogenic intersection.J Cancer Res Clin Oncol. 2023 Jan;149(1):483-501. doi: 10.1007/s00432-022-04447-7. Epub 2022 Oct 31. J Cancer Res Clin Oncol. 2023. PMID: 36310300 Free PMC article. Review.
-
Lung endothelial HO-1 targeting in vivo using lentiviral miRNA regulates apoptosis and autophagy during oxidant injury.FASEB J. 2013 Oct;27(10):4041-58. doi: 10.1096/fj.13-231225. Epub 2013 Jun 14. FASEB J. 2013. PMID: 23771928 Free PMC article.
References
-
- Agarwal A., Nick H. S. (2000) Renal response to tissue injury: lessons from heme oxygenase-1 GeneAblation and expression. J. Am. Soc. Nephrol. 11, 965–973 - PubMed
-
- Nath K. A. (2006) Heme oxygenase-1: a provenance for cytoprotective pathways in the kidney and other tissues. Kidney Int. 70, 432–443 - PubMed
-
- Loboda A., Jazwa A., Grochot-Przeczek A., Rutkowski A. J., Cisowski J., Agarwal A., Jozkowicz A., Dulak J. (2008) Heme oxygenase-1 and the vascular bed: from molecular mechanisms to therapeutic opportunities. Antioxid. Redox Signal 10, 1767–1812 - PubMed
-
- Wagener F. A., Eggert A., Boerman O. C., Oyen W. J., Verhofstad A., Abraham N. G., Adema G., van Kooyk Y., de Witte T., Figdor C. G. (2001) Heme is a potent inducer of inflammation in mice and is counteracted by heme oxygenase. Blood 98, 1802–1811 - PubMed
Publication types
MeSH terms
Substances
Grants and funding
LinkOut - more resources
Full Text Sources
Medical
Research Materials
Miscellaneous
