. 2012 Sep 28;287(40):33691-705.
doi: 10.1074/jbc.M112.379792. Epub 2012 Jul 27.

Novel one-step immunoassays to quantify α-synuclein: applications for biomarker development and high-throughput screening

Affiliations

Novel one-step immunoassays to quantify α-synuclein: applications for biomarker development and high-throughput screening

Michael Bidinosti et al. J Biol Chem. .

Abstract

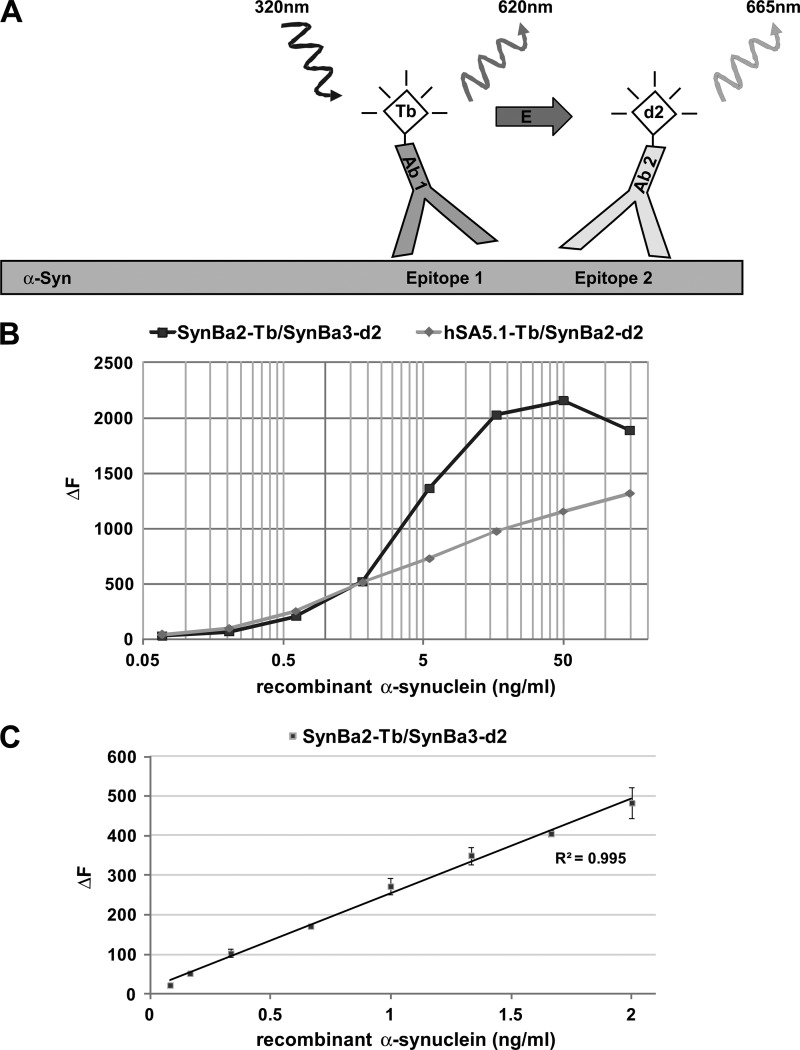
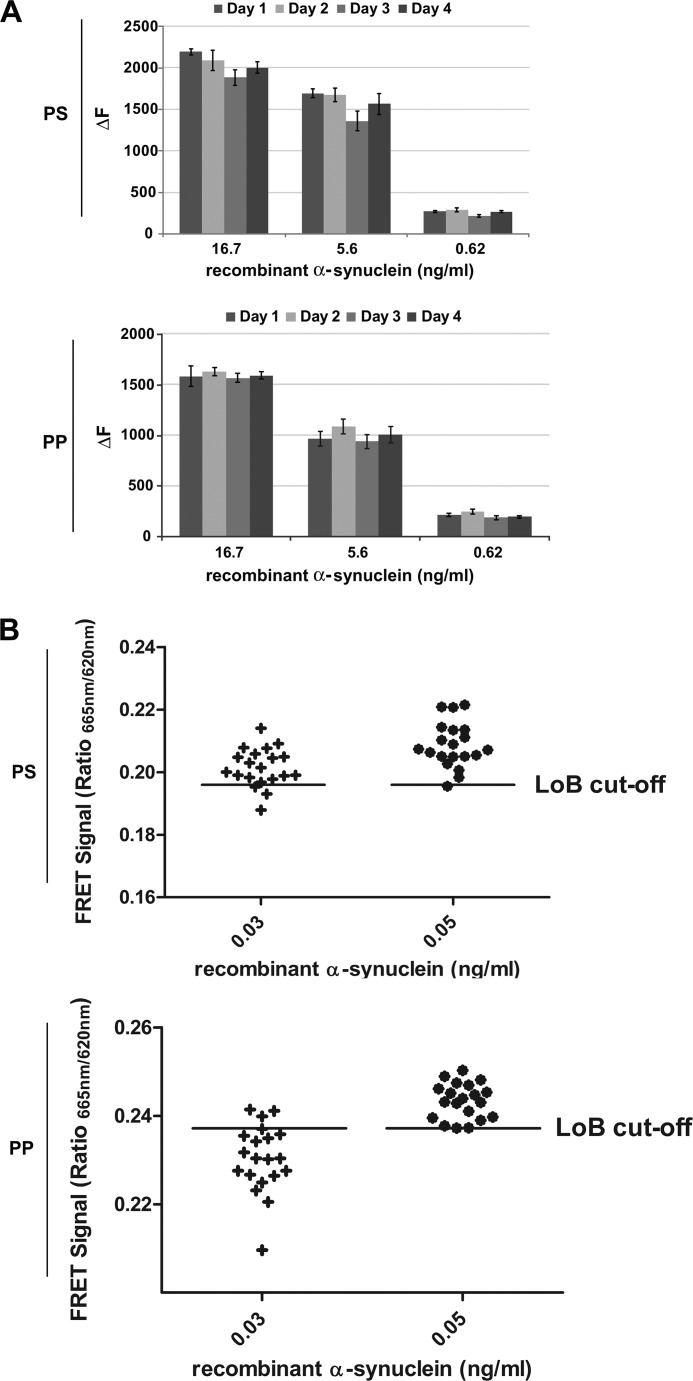
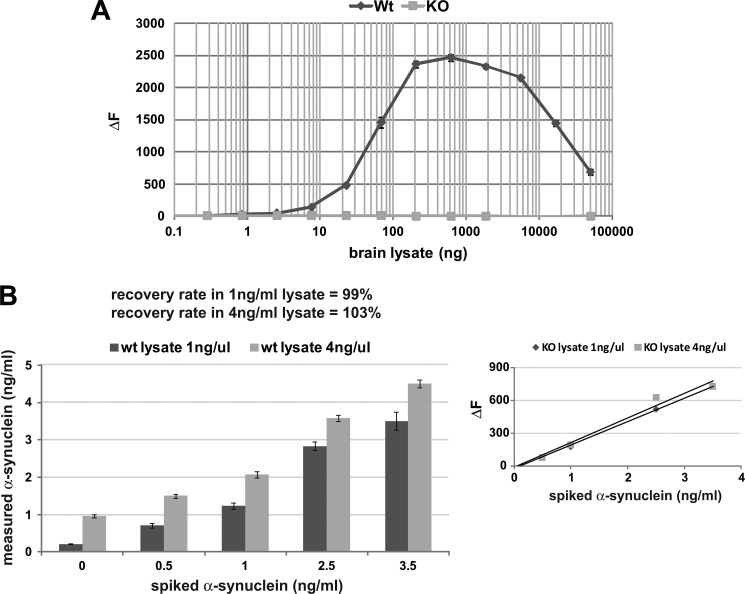
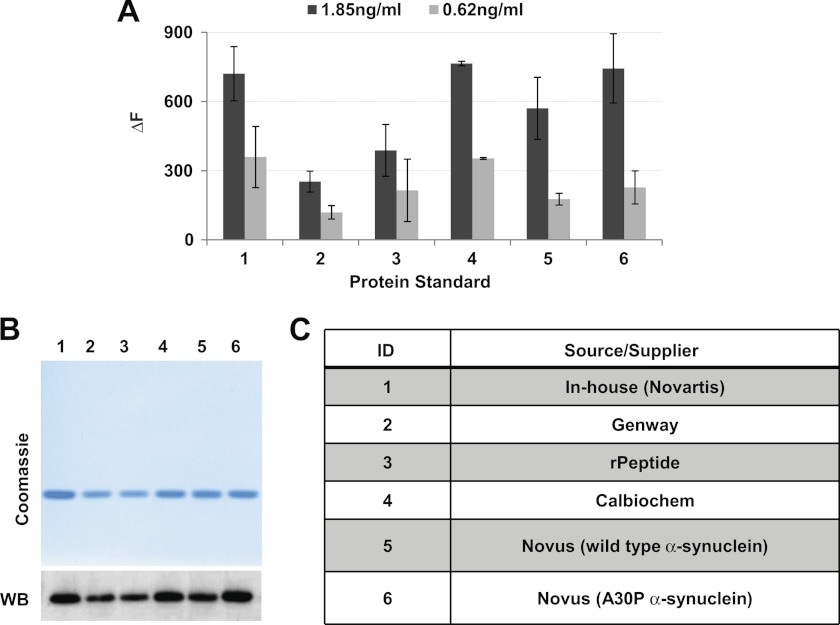
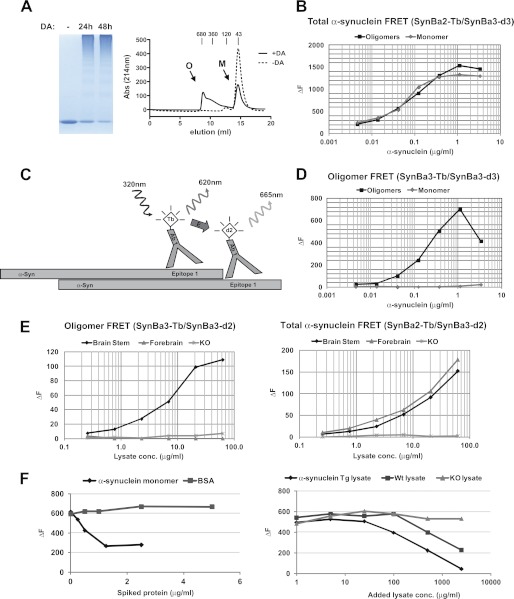
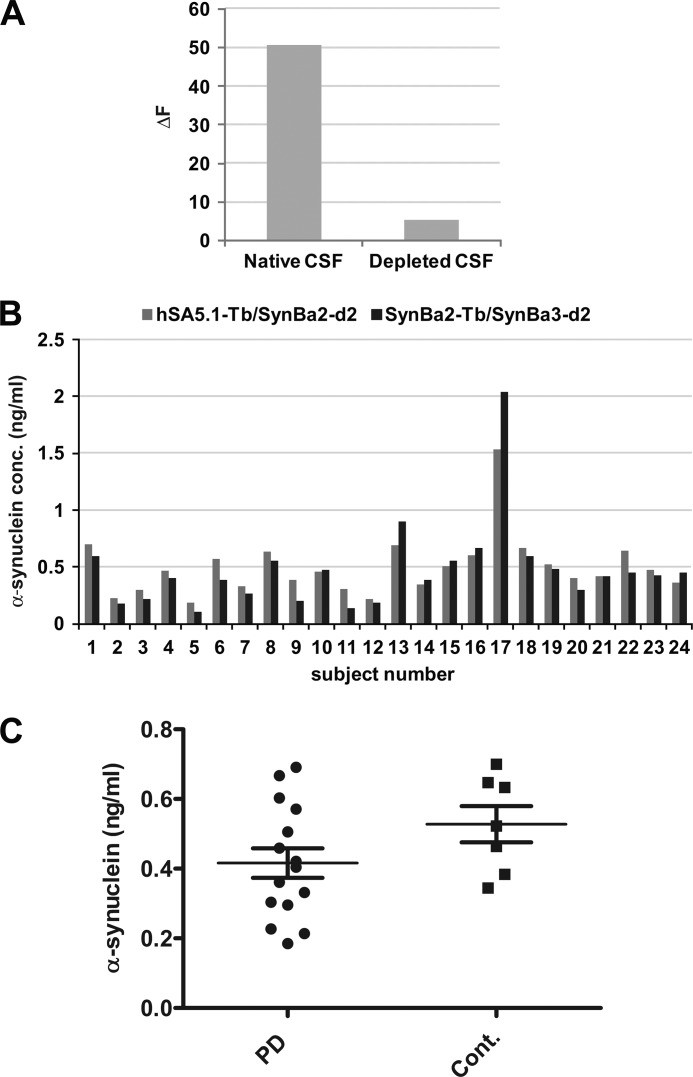
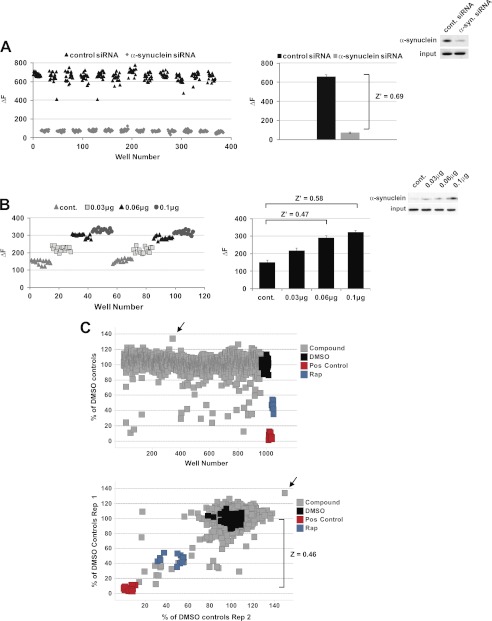
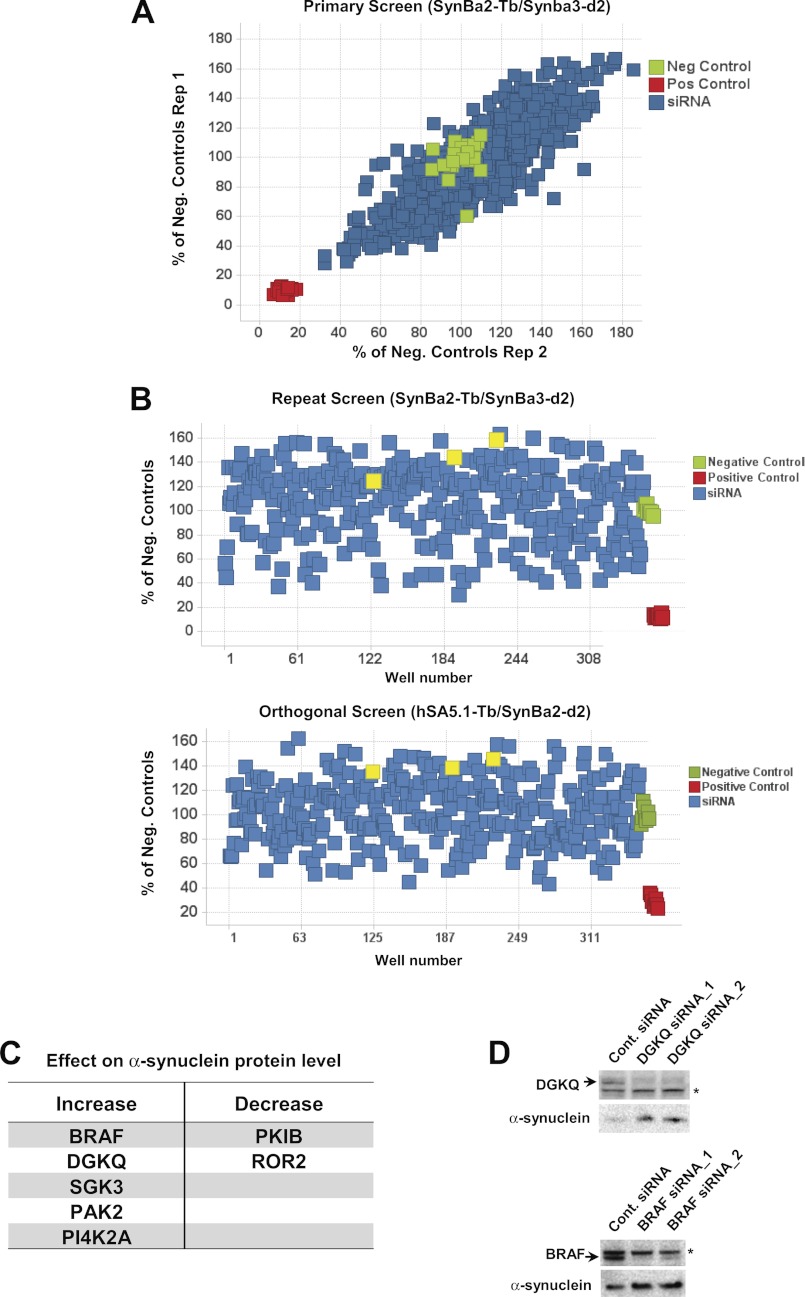
Familial Parkinson disease (PD) can result from α-synuclein gene multiplication, implicating the reduction of neuronal α-synuclein as a therapeutic target. Moreover, α-synuclein content in human cerebrospinal fluid (CSF) represents a PD biomarker candidate. However, capture-based assays for α-synuclein quantification in CSF (such as by ELISA) have shown discrepancies and have limited suitability for high-throughput screening. Here, we describe two sensitive, in-solution, time-resolved Förster's resonance energy transfer (TR-FRET)-based immunoassays for total and oligomeric α-synuclein quantification. CSF analysis showed strong concordance for total α-synuclein content between two TR-FRET assays and, in agreement with a previously characterized 36 h protocol-based ELISA, demonstrated lower α-synuclein levels in PD donors. Critically, the assay suitability for high-throughput screening of siRNA constructs and small molecules aimed at reducing endogenous α-synuclein levels was established and validated. In a small-scale proof of concept compound screen using 384 well plates, signals ranged from <30 to >120% of the mean of vehicle-treated cells for molecules known to lower and increase cellular α-synuclein, respectively. Furthermore, a reverse genetic screen of a kinase-directed siRNA library identified seven genes that modulated α-synuclein protein levels (five whose knockdown increased and two that decreased cellular α-synuclein protein). This provides critical new biological insight into cellular pathways regulating α-synuclein steady-state expression that may help guide further drug discovery efforts. Moreover, we describe an inherent limitation in current α-synuclein oligomer detection methodology, a finding that will direct improvement of future assay design. Our one-step TR-FRET-based platform for α-synuclein quantification provides a novel platform with superior performance parameters for the rapid screening of large biomarker cohorts and of compound and genetic libraries, both of which are essential to the development of PD therapies.


Figures

FIGURE 1.
FIGURE 1.
Design of TR-FRET immunoassay and dynamic range for recombinant α-synuclein. A, shown is representation of the TR-FRET assay principle. Coincident, in-solution binding of two fluorophore-labeled antibodies to unique epitopes on α-synuclein generates the TR-FRET signal. Excitation of the Tb donor fluorophore causes both analyte-independent fluorescence (620 nm) and non-radiative energy transfer to the d2 acceptor fluorophore. The latter TR-FRET signal (665 nm) is dependent on the presence of α-synuclein. B, shown is broad range dilution of α-synuclein and detection by the antibody pairs SynBa2-Tb/SynBa3-d2 and hSA5.1-Tb/SynBa2-d2. Recombinant α-synuclein was serially diluted in lysis buffer (PBS containing 1% Triton X-100) starting from 150 ng/ml in polystyrene 384-well microtiter plates followed by TR-FRET detection (average of duplicates). C, TR-FRET detection at low α-synuclein concentrations is shown. Recombinant α-synuclein was fractionally diluted in polystyrene plates to concentrations between 2 and 0.02 ng/ml followed by detection with SynBa2-Tb/SynBa3-d2.
FIGURE 2.
FIGURE 2.
Characterization of α-synuclein TR-FRET assay robustness and LoD. A, interassay variability assessment in PS and PP plates is shown. Recombinant α-synuclein was serially diluted (quadruplicates) freshly on each of four independent days in 384-well microtiter plates, as indicated, followed by TR-FRET detection. Fluorescence measurements were taken 20 h after antibody addition. B, the α-synuclein limits of detection in polystyrene and polypropylene plates were determined according to the procedure outlined by the Clinical Laboratory and Standards Institute (29). Recombinant α-synuclein was prepared at low concentrations corresponding to putative limits of detection as calculated from pilot experiments. Twenty replicates of each sample were then measured, and the LoD was accepted for concentrations at which at least 95% of the samples yielded TR-FRET signals above the LoB cut-off (determined from 40 blank replicates).
FIGURE 3.
FIGURE 3.
Determination of α-synuclein TR-FRET assay specificity and recovery rate. A, shown is antibody specificity determination using murine brain lysates. Wild type (Wt) or α-synuclein knock-out (KO) brains were homogenized in PBS, 1% Triton X-100-containing protease inhibitors, and lysates were serially diluted (triplicates) starting at 5000 ng/well in polystyrene 384-well microtiter plates followed by TR-FRET detection. B, assessment of α-synuclein recovery rate in brain lysates is shown. Wild type brain lysates at two concentrations were spiked with recombinant α-synuclein at the indicated concentrations followed by TR-FRET detection. Recovery rates were calculated from measured α-synuclein concentrations relative to spiked amounts. The calibration curve (below) was built by spiking recombinant α-synuclein into KO brains lysates.
FIGURE 4.
FIGURE 4.
Characterization of several recombinant α-synuclein proteins as standards in the TR-FRET assay. A, six α-synuclein proteins from independent sources were plated in triplicate at the indicated concentrations on 384-well microtiter plates. TR-FRET analysis was with SynBa2-Tb/SynBa3-d2. Protein concentrations provided by the supplier were used to normalize protein input. B, Coomassie staining and Western blotting (WB) were used to evaluate the relative abundance of α-synuclein standards. C, shown is a table of identification and suppliers of recombinant standards.
FIGURE 5.
FIGURE 5.
Development of TR-FRET assay for detection of oligomeric α-synuclein. A, generation and purification of an oligomeric α-synuclein standard by SEC is shown. Left panel, shown is SDS-PAGE/Coomassie analysis of recombinant α-synuclein after treatment with 2 mm dopamine (DA) for the indicated times to induce oligomerization. Right panel, shown are SEC profiles of mock and dopamine-treated α-synuclein (24 h). Arrows indicate oligomeric (O) and monomeric (M) α-synuclein elution peaks. B, TR-FRET analysis of purified monomeric and oligomeric α-synuclein from SEC is shown. Oligomeric and monomeric α-synuclein from A were serially diluted in 384-well plates followed by TR-FRET with SynBa2-Tb/SynBa3-d2. C, representation of oligomer-specific α-synuclein TR-FRET assay is shown. D, shown is a specificity assessment of oligomer-directed TR-FRET assay. Purified oligomeric and monomeric α-synuclein from A were serially diluted in 384-well plates followed by TR-FRET. E, TR-FRET detection of α-synuclein oligomers in vivo is shown. The indicated brain regions of transgenic mice expressing human α-synuclein (A53T) were homogenized in PBS, 1% Triton X-100 and serially diluted in 384-well plates before SynBa3-Tb/SynBa3-d2 oligomer analysis (left panel) or SynBa2-Tb/SynBa3-d2 for total α-synuclein detection (right panel). F, competition analysis using spiked monomeric α-synuclein in oligomer-specific TR-FRET assay is shown. Oligomeric recombinant α-synuclein (1 μg/ml) was mixed with the indicated amounts of recombinant α-synuclein monomers (left panel) or with murine brain lysates of increasing concentration from transgenic, wild type, or α-synuclein KO animals (right panel).
FIGURE 6.
FIGURE 6.
TR-FRET quantification of α-synuclein in human CSF. A, establishment of immunodepleted CSF for use as a calibration matrix is shown. Human CSF was subjected to immunoprecipitation of α-synuclein by incubation for 1.5 h with hSA5.1 antibody followed by two rounds of capture with protein G beads. Subsequent TR-FRET analysis was with SynBa2-TB/SynBa3-d2. B, shown is quantification of α-synuclein content in the CSF of donors from various collections by two TR-FRET antibody pairs. C, shown is comparison of α-synuclein concentrations in PD and healthy control patient CSF. Data are presented as individual sample values (means of replicates) with group means (±S.E.) indicated.
FIGURE 7.
FIGURE 7.
Assessment of TR-FRET assay suitability for HTS and screening of a small natural compound library. A, establishment of siRNA screening controls is shown. Positive and negative control siRNAs for α-synuclein knockdown were transfected in HEK293T cells in alternating columns of a 384-well microplate, and 72 h post-transfection cells were lysed followed by in-well TR-FRET detection. Individual well values are plotted column-wise in the left panel, and combined means of controls from the entire plate are plotted on the right. The Z′ factor (see “Experimental Procedures”) was calculated from the entire plate's data. B, shown was screening window determination for increased α-synuclein. HEK293T cells were transfected with increasing concentrations of α-synuclein cDNA and replated in 384-well plates 24 h later (duplicate columns per condition). Cells were lysed after a further 24 h, and TR-FRET detection and Z′ factor calculation were performed as in A. C, screening of a natural compound library is shown. 965 randomly selected natural compounds were preplated in 384-well microplates followed by the addition of HEK293T cells in growth medium to yield final compound concentrations of 5 μm (0.25% DMSO). After 48 h of treatment, cell lysis and TR-FRET detection were performed as in A. Sample ΔF values were normalized to same-plate DMSO controls. Z factor calculation compares the mean of test compound values and variation against that of a toxic positive control, benzalkonium chloride (Pos control). Rapamycin (Rap) was included as an additional positive control. Wells containing the histone deacetylase inhibitor (suberohydroxamic acid) are indicated by arrows. Correlation of duplicate screens is shown in the lower panel.
FIGURE 8.
FIGURE 8.
siRNA-based screening of human kinases for modulation of total cellular α-synuclein concentration. A, shown is a primary screen of a kinase siRNA library targeting 535 genes (total of 912 unique siRNAs) in duplicate on non-consecutive days. HEK293T cells were reverse-transfected by plating onto preformed siRNA-Lipofectamine 2000 complexes in 384-well plates. Cell lysis and TR-FRET detection 72 h later was as in Fig. 6A. B, for retesting with the same (SynBa2-Tb/SynBa3-d2) and orthogonal (hSA5.1-Tb/SynBa2-d2) TR-FRET readouts, 351 unique siRNAs targeting 80 kinases (minimum 3 siRNAs/gene) were screened as in A. The selected kinases exhibited greater than ±25% change in total α-synuclein in the primary screen (Fig. 6A). DGKQ siRNAs are colored in yellow. C, shown is a table of screening hits. Kinases whose knockdown resulted in an increase or decrease in total α-synuclein protein of more than 25% with at least half of all same-gene siRNAs in both the focused re-test and orthogonal screens were declared as positive hits. D, Western blotting of lysates from HEK293T cells transfected with control or selected siRNAs targeting the kinome screen hits DGKQ or BRAF is shown. Lysates were prepared from cells harvested 72 h after transfection. Nonspecific proteins bands are marked with asterisks.

Similar articles

Cited by

References

    1. Spillantini M. G., Schmidt M. L., Lee V. M., Trojanowski J. Q., Jakes R., Goedert M. (1997) α-Synuclein in Lewy bodies. Nature 388, 839–840 - PubMed
    1. Cooper A. A., Gitler A. D., Cashikar A., Haynes C. M., Hill K. J., Bhullar B., Liu K., Xu K., Strathearn K. E., Liu F., Cao S., Caldwell K. A., Caldwell G. A., Marsischky G., Kolodner R. D., Labaer J., Rochet J. C., Bonini N. M., Lindquist S. (2006) α-Synuclein blocks ER-Golgi traffic, and Rab1 rescues neuron loss in Parkinson models. Science 313, 324–328 - PMC - PubMed
    1. Nemani V. M., Lu W., Berge V., Nakamura K., Onoa B., Lee M. K., Chaudhry F. A., Nicoll R. A., Edwards R. H. (2010) Increased expression of α-synuclein reduces neurotransmitter release by inhibiting synaptic vesicle reclustering after endocytosis. Neuron 65, 66–79 - PMC - PubMed
    1. Thayanidhi N., Helm J. R., Nycz D. C., Bentley M., Liang Y., Hay J. C. (2010) α-Synuclein delays endoplasmic reticulum (ER)-to-Golgi transport in mammalian cells by antagonizing ER/Golgi SNAREs. Mol. Biol. Cell 21, 1850–1863 - PMC - PubMed
    1. Singleton A. B., Farrer M., Johnson J., Singleton A., Hague S., Kachergus J., Hulihan M., Peuralinna T., Dutra A., Nussbaum R., Lincoln S., Crawley A., Hanson M., Maraganore D., Adler C., Cookson M. R., Muenter M., Baptista M., Miller D., Blancato J., Hardy J., Gwinn-Hardy K. (2003) α-Synuclein locus triplication causes Parkinson disease. Science 302, 841. - PubMed

Publication types

MeSH terms