. 2012 Nov 15;303(10):C1021-33.
doi: 10.1152/ajpcell.00191.2012. Epub 2012 Jul 25.

Activation of Toll-like receptor 3 amplifies mesenchymal stem cell trophic factors and enhances therapeutic potency

Affiliations

Activation of Toll-like receptor 3 amplifies mesenchymal stem cell trophic factors and enhances therapeutic potency

Michalis Mastri et al. Am J Physiol Cell Physiol. .

Abstract

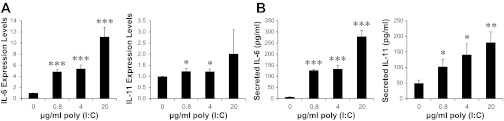
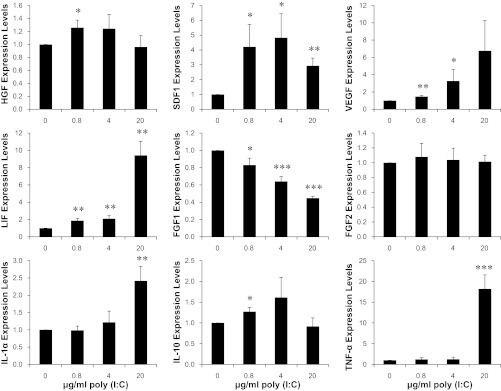
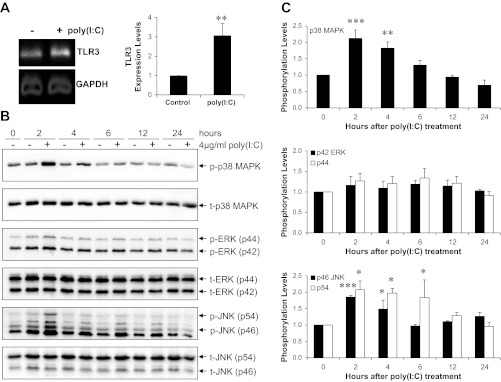
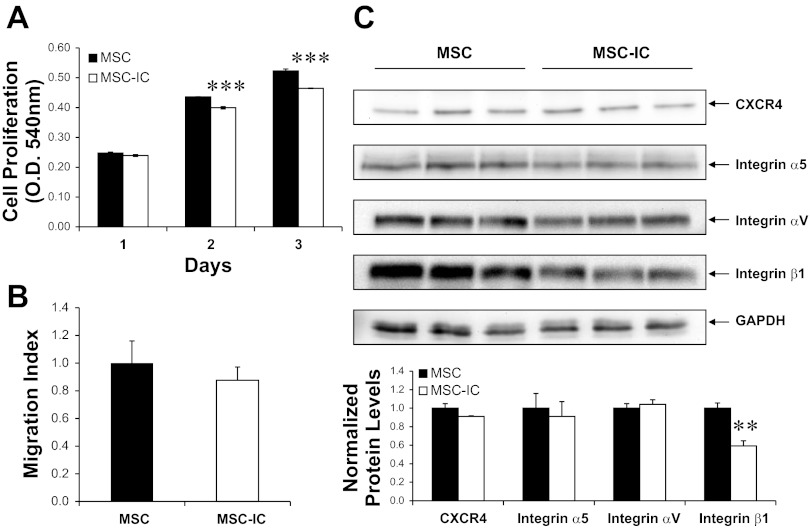
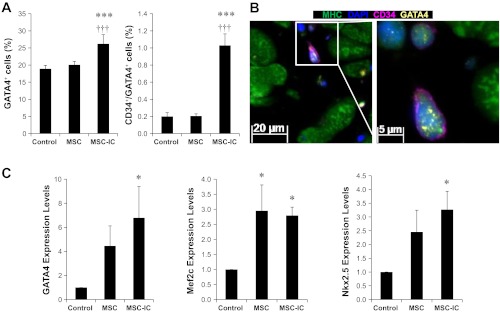
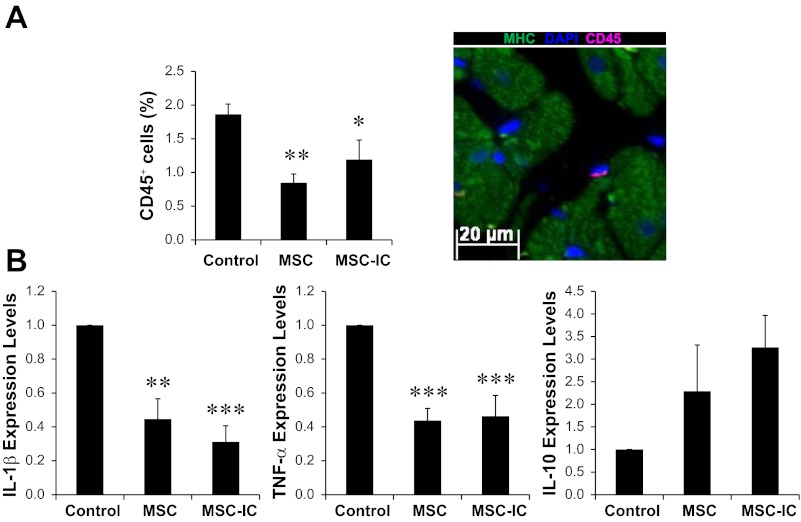
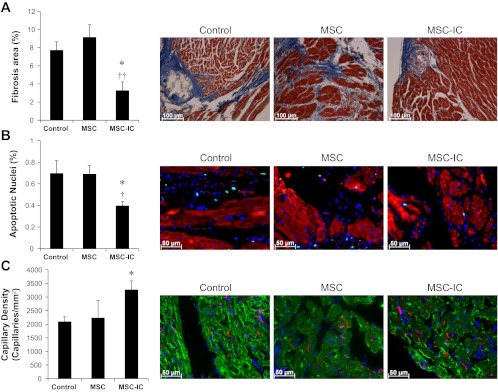
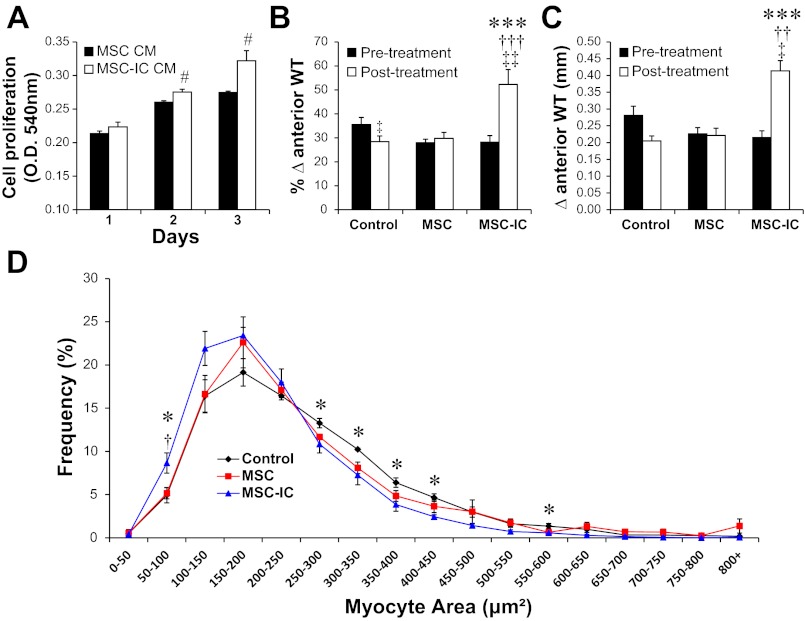
Clinical trials of bone marrow mesenchymal stem cell (MSC) therapy have thus far demonstrated moderate and inconsistent benefits, indicating an urgent need to improve therapeutic efficacy. Although administration of sufficient cells is necessary to achieve maximal therapeutic benefits, documented MSC clinical trials have largely relied on injections of ∼1 × 10(6) cells/kg, which appears too low to elicit a robust therapeutic response according to published preclinical studies. However, repeated cell passaging necessary for large-scale expansion of MSC causes cellular senescence and reduces stem cell potency. Using the RNA mimetic polyinosinic-polycytidylic acid [poly(I:C)] to engage MSC Toll-like receptor 3 (TLR3), we found that poly(I:C), signaling through multiple mitogen-activated protein kinase pathways, induced therapeutically relevant trophic factors such as interleukin-6-type cytokines, stromal-derived factor 1, hepatocyte growth factor, and vascular endothelial growth factor while slightly inhibiting the proliferation and migration potentials of MSC. At the suboptimal injection dose of 1 × 10(6) cells/kg, poly(I:C)-treated MSC, but not untreated MSC, effectively stimulated regeneration of the failing hamster heart 1 mo after cell administration. The regenerating heart exhibited increased CD34(+)/Ki67(+) and CD34(+)/GATA4(+) progenitor cells in the presence of decreased inflammatory cells and cytokines. Cardiac functional improvement was associated with a ∼50% reduction in fibrosis, a ∼40% reduction in apoptosis, and a ∼55% increase in angiogenesis, culminating in prominent cardiomyogenesis evidenced by abundant distribution of small myocytes and a ∼90% increase in wall thickening. These functional, histological, and molecular characterizations thus establish the utility of TLR3 engagement for enabling the low-dose MSC therapy that may be translated to more efficacious clinical applications.


Figures

Fig. 1.
Fig. 1.
Polyinosinic-polycytidylic acid [poly(I:C)] increases expression of mesenchymal stem cell (MSC) IL-6-type cytokines. MSC (5 × 10⁵ cells per 35-mm dish) maintained in DMEM/F-12 supplemented with 10% FBS were treated with an equal volume of saline, which served as no poly(I:C) control, or 0.8–20 μg/ml poly(I:C). Cells and culture medium were harvested after 24 h, and expression of IL-6 and IL-11 was analyzed by qRT-PCR (A) and ELISA (B). GAPDH was used as the reference gene in PCR analysis. Concentrations of IL-6 and IL-11 present in the conditioned-medium are expressed as pg/ml. n = 3–4; *P < 0.05, **P < 0.01, and ***P < 0.001 vs. no poly(I:C) control.
Fig. 2.
Fig. 2.
Poly(I:C) differentially affects expression of MSC trophic factors. MSC (5 × 10⁵ cells per 35-mm dish) maintained in DMEM/F-12 supplemented with 10% FBS were treated with an equal volume of saline, which served as no poly(I:C) control, or 0.8–20 μg/ml poly(I:C). Cells were harvested after 24 h for qRT-PCR analysis of trophic factor gene expression using GAPDH as the reference gene. LIF, leukemia inhibitory factor; HGF, hepatocyte growth factor; SDF1, stromal-derived factor 1. n = 3–4; *P < 0.05, **P < 0.01, and ***P < 0.001 vs. no poly(I:C) control.
Fig. 3.
Fig. 3.
MSC Toll-like receptor 3 (TLR3) activation is mediated through MAPK signaling pathways. A: qRT-PCR analysis of MSC TLR3 expression in response to poly(I:C) treatment. Representative qRT-PCR products were fractionated by agarose gel electrophoresis (left) and relative expression levels derived from CT are illustrated (right, n = 4). B: MSC were treated with 4 μg/ml poly(I:C) for 2–24 h, following which cells were harvested and processed for SDS-PAGE and Western blot analysis. Proteins (45 μg) were loaded in each lane. Representative Western blots of three independent experiments examining p38 MAPK, JNK/SAPK, and ERK1/2 are illustrated. C: digital quantification of the three signaling pathways. Phosphorylation levels represent the ratios of each phosphorylated kinase to the respective total kinase at the time points illustrated. n = 3; *P < 0.05, **P < 0.01, and ***P < 0.001 vs. no poly(I:C) control.
Fig. 4.
Fig. 4.
MSC proliferation and migration are marginally affected by poly(I:C) treatment. MSC were treated with saline (MSC) or 4 μg/ml poly(I:C) (MSC-IC) for 24 h and washed to remove poly(I:C). Poly(I:C)-treated MSC are designated as MSC-IC. Cells were then analyzed by MTT assay, migration assay, and Western blotting. A: cells were plated in 24-well plates (105 cells/well). MTT assays were performed 1, 2, and 3 days after plating. OD, optical density. B: transwell migration assay for MSC and MSC-IC. Migration index is defined as the ratio of migrated MSC-IC to migrated MSC. C: cells were harvested 2 days after plating and processed for SDS-PAGE and Western blot analysis. Proteins (45 μg) were loaded in each lane. The ratios of chemokine receptor CXCR4, integrin β1, integrin α5, and integrin αV to GAPDH are graphed. n = 3; **P < 0.01 and ***P < 0.001 vs. untreated MSC.
Fig. 5.
Fig. 5.
Echocardiography shows poly(I:C) treatment enhances low-dose MSC therapy for heart failure. Echocardiography was performed in an operator-blinded manner before and 1 mo after MSC treatment. Poly(I:C)-treated MSC are designated as MSC-IC. Left ventricular ejection fraction (LVEF), fractional shortening (FS), LV end-diastolic dimension (LVDd), and LV end-systolic dimension (LVDs) are presented in the context of three cell dose groups: 40 × 106/kg, 1 × 10⁶/kg, and 1 × 10⁵/kg, which represent 4 × 10⁶, 1 × 10⁵, and 1 × 10⁴ MSC per animal, respectively. Effect of 4 μg/ml poly(I:C) treatment was tested for the 1 × 10⁶/kg and 1 × 10⁵/kg groups only. n = 4–11 per group; *P < 0.05 vs. pretreatment; **P < 0.01 vs. pretreatment; ***P < 0.001 vs. pretreatment; †P < 0.05 vs. saline control; ††P < 0.01 vs. saline control; †††P < 0.001 vs. saline control; ‡P < 0.05 vs. 40 × 106 MSC/kg; ‡‡‡P < 0.001 vs. 40 × 106 MSC/kg; formula image
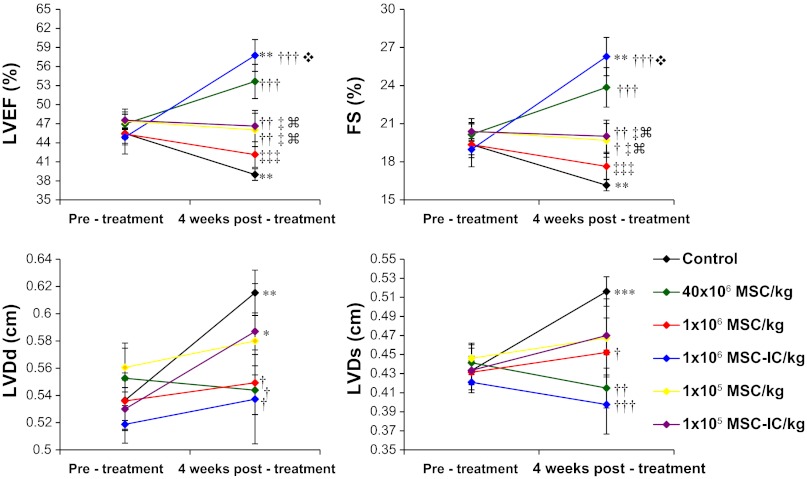
P < 0.001 vs. 1 × 10⁶ MSC/kg; formula imageP < 0.001 vs. 1 × 10⁶ MSC-IC/kg.
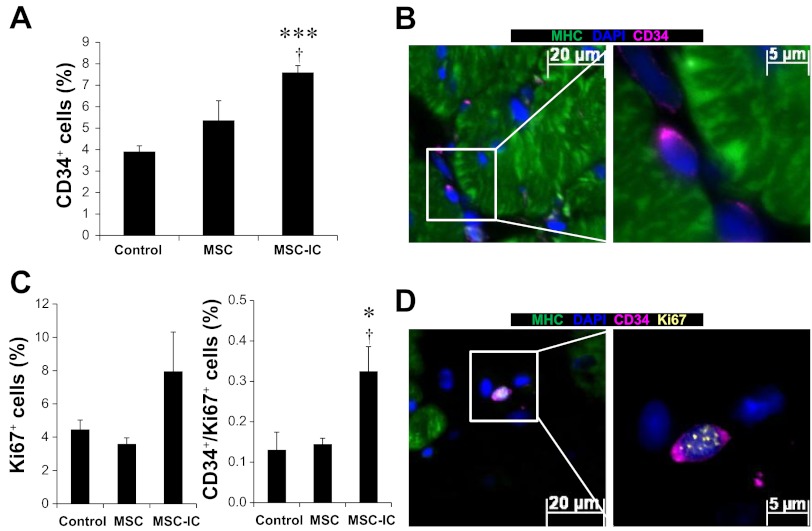
Fig. 6.
Fig. 6.
Amplification of CD34+/Ki67+ progenitor cells by poly(I:C)-conditioned MSC. Paraffin sections were prepared from ventricular tissue 1 mo after the low-dose (1 × 10⁶ cells/kg) MSC therapy. CD34 antibody (pink), myosin heavy chain (MHC) antibody (green), Ki67 antibody (yellow), and DAPI (blue) were used. A: quantification of CD34+ cells. B: a representative MHC/CD34+ cell from the TO2 heart is illustrated at two magnifications (×200 and ×630). The highlighted area was imaged at ×630 magnification. C: quantification of total Ki67+ and CD34+/Ki67+ progenitor cells. D: a representative image of a MHC/CD34+/Ki67+ progenitor cell. n = 3–4 per group; †P < 0.05 vs. MSC, *P < 0.05 and ***P < 0.001 vs. saline control.
Fig. 7.
Fig. 7.
Amplification of CD34+/GATA4+ progenitor cells by poly(I:C)-conditioned MSC. A: paraffin sections were prepared from ventricular tissue 1 mo after the low-dose (1 × 10⁶ cells/kg) MSC therapy. CD34 antibody (pink), MHC antibody (green), GATA4 antibody (yellow), and DAPI (blue) were used. Quantification of GATA4+ and CD34+/GATA4+ progenitor cells is presented. B: a representative MHC/CD34+/GATA4+ progenitor cell is illustrated at two magnifications (×200 and ×630). The highlighted area was imaged at ×630 magnification. C: qRT-PCR analysis of the cardiac transcription factors GATA4, Nkx2.5, and Mef2c. n = 3–4 per group; *P < 0.05 vs. saline control; ***P < 0.001 vs. saline control; †††P < 0.001 vs. untreated MSC.
Fig. 8.
Fig. 8.
MSC therapy attenuates myocardial inflammation independent of poly(I:C) treatment. A: paraffin sections were prepared from ventricular tissue 1 mo after the low-dose (1 × 10⁶ cells/kg) MSC therapy. CD45 antibody (pink) was used to identify and quantify myocardial immune cells. MHC antibody (green) was used to stain cardiomyocytes. DAPI (blue) was used to stain nuclei. Quantification of CD45+ cells is presented and a representative CD45+ cell is illustrated (×200). B: RNA was isolated from the heart and analyzed by qRT-PCR to determine expression of the inflammatory cytokines IL-1β, TNF-α, and the antiinflammatory cytokine IL-10. n = 3–4 per group; *P < 0.05, **P < 0.01, and ***P < 0.001 vs. saline control.
Fig. 9.
Fig. 9.
Antifibrotic, antiapoptotic, and proangiogenic activities are promoted by poly(I:C)-treated MSC. Heart tissue sections were prepared 1 mo after the low-dose (1 × 10⁶ cells/kg) MSC therapy and processed for analysis of fibrosis, apoptosis, and angiogenesis. A: analysis of myocardial fibrosis by trichrome staining. B: analysis of myocardial apoptosis by TUNEL staining. Myocytes were stained by a troponin T antibody (red). Total nuclei were stained by DAPI (blue). Apoptotic nuclei are cyan colored. C: analysis of capillary density by GSL-IB4 staining. Myocytes were stained by a troponin T antibody (green). Total nuclei were stained by DAPI (blue). Capillaries are red/pink colored. Representative images of fibrosis, apoptosis, and stained capillaries for each group are illustrated (×200). n = 3–4 per group; *P < 0.05 vs. saline control; †P < 0.05 and ††P < 0.01 vs. untreated MSC.
Fig. 10.
Fig. 10.
Poly(I:C)-treated MSC effectively promotes formation of new cardiomyocytes. A: HL-1 cardiomyocytes preplated in a 24-well plate were treated with 50% MSC-conditioned medium (MSC CM or MSC-IC CM). Cell proliferation was monitored by MTT assays for 3 days, comparing the difference between MSC CM and MSC-IC CM at the time points indicated; n = 3. B and C: echocardiography was used to measure % anterior wall thickening (B) and anterior wall thickness (Δanterior WT) (C). Heart tissue sections were prepared 1 mo after the low-dose (1 × 10⁶ cells/kg) MSC therapy. H&E-stained paraffin sections were used for morphometric analysis. D: myocyte size distribution analysis derived from the morphometric analysis. n = 4 per group; *P < 0.05 and ***P < 0.001 saline control vs. MSC-IC; †P < 0.01 and †††P < 0.001 untreated MSC vs. MSC-IC; ††P < 0.01 untreated MSC vs. MSC-IC; ‡P < 0.05; ‡‡P < 0.01 vs. pretreatment; #P < 0.01 vs. MSC CM.

Comment in

References

    1. Alexopoulou L, Holt AC, Medzhitov R, Flavell RA. Recognition of double-stranded RNA and activation of NF-kappaB by Toll-like receptor 3. Nature 413: 732– 738, 2001 - PubMed
    1. Allison M. Genzyme backs Osiris, despite Prochymal flop. Nat Biotechnol 27: 966– 967, 2009 - PubMed
    1. Alreja G, Bugano D, Lotfi A. Effect of remote ischemic preconditioning on myocardial and renal injury: meta-analysis of randomized controlled trials. J Invasive Cardiol 24: 42– 48, 2012 - PubMed
    1. Bai L, Lennon DP, Caplan AI, Dechant A, Hecker J, Kranso J, Zaremba A, Miller RH. Hepatocyte growth factor mediates mesenchymal stem cell-induced recovery in multiple sclerosis models. Nat Neurosci 2012 - PMC - PubMed
    1. Barbash IM, Chouraqui P, Baron J, Feinberg MS, Etzion S, Tessone A, Miller L, Guetta E, Zipori D, Kedes LH, Kloner RA, Leor J. Systemic delivery of bone marrow-derived mesenchymal stem cells to the infarcted myocardium: feasibility, cell migration, and body distribution. Circulation 108: 863– 868, 2003 - PubMed

Publication types