. 2012 Nov;85 Spec No 1(Spec Iss 1):S3-17.
doi: 10.1259/bjr/56357549. Epub 2012 Jul 27.

Applications of transrectal ultrasound in prostate cancer

Affiliations

Applications of transrectal ultrasound in prostate cancer

C J Harvey et al. Br J Radiol. 2012 Nov.

Abstract

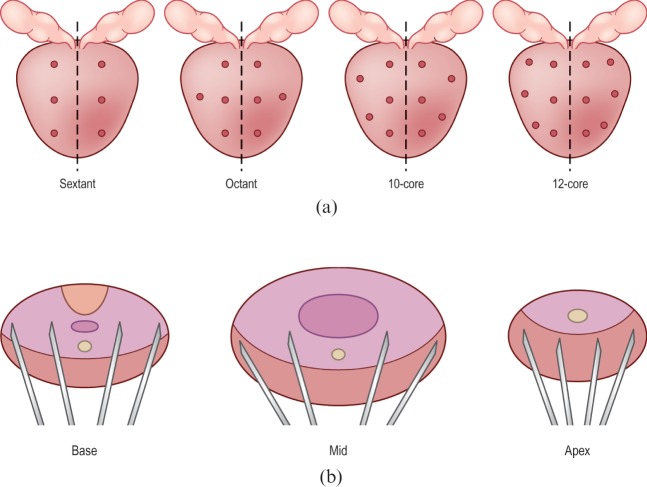
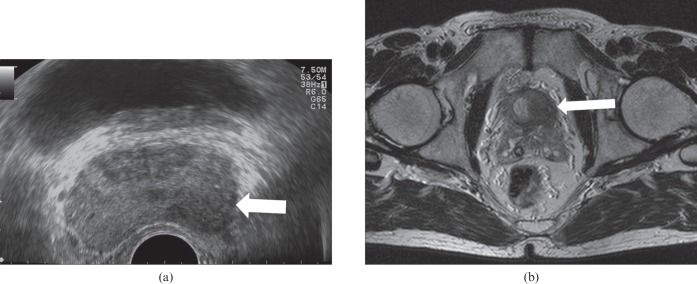
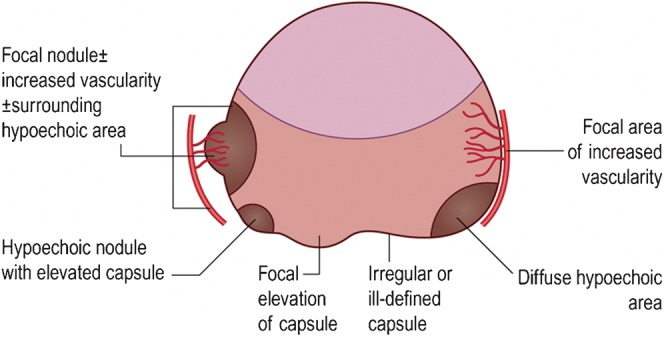
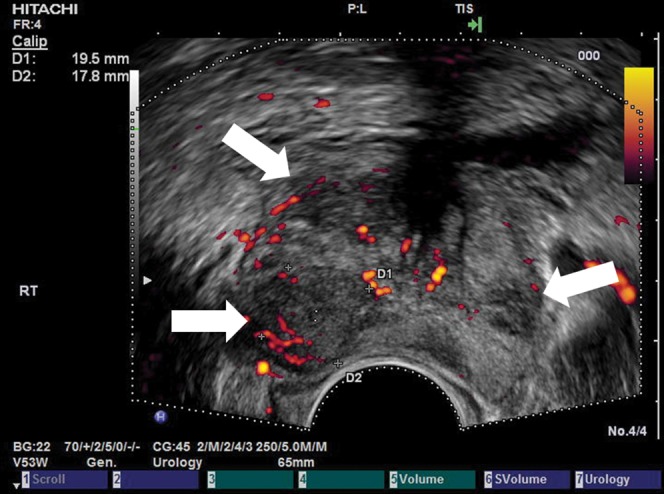
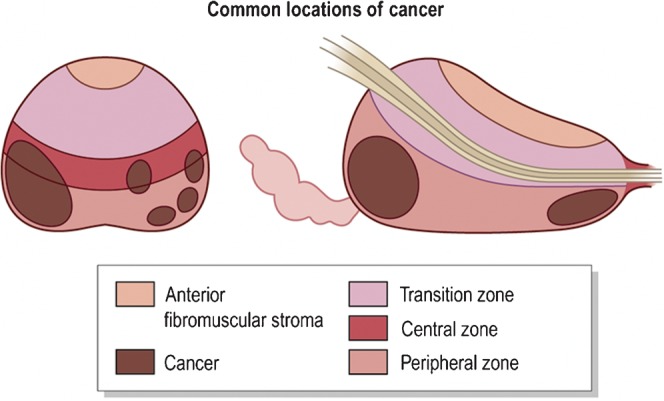
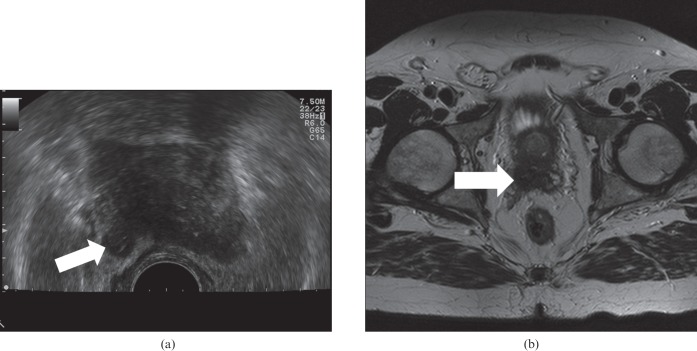
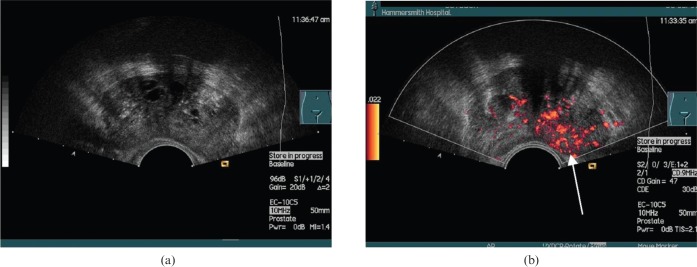
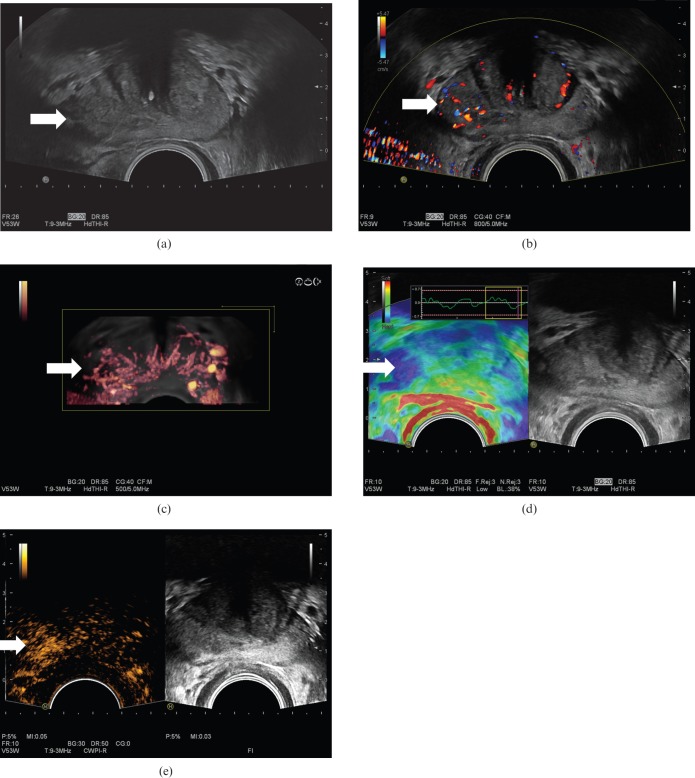
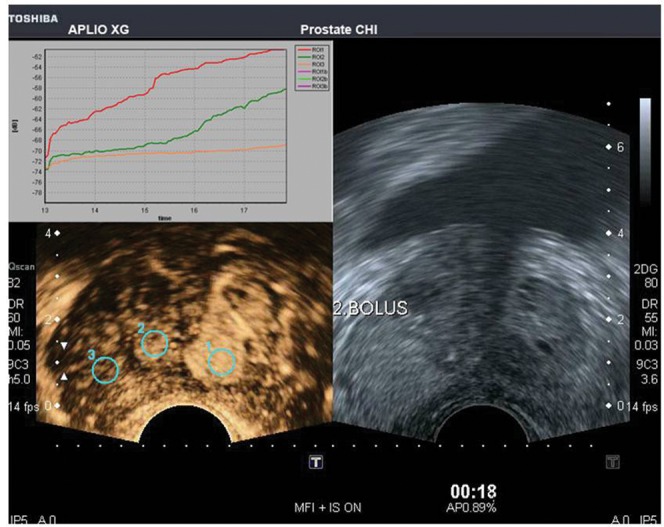
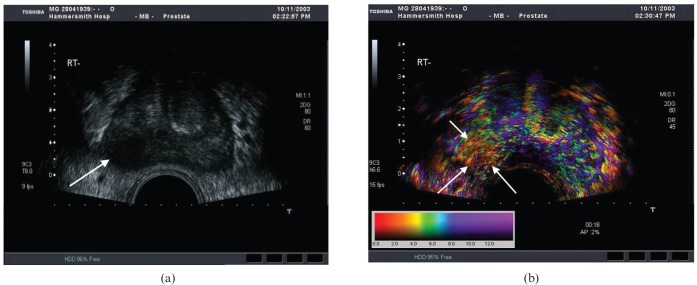
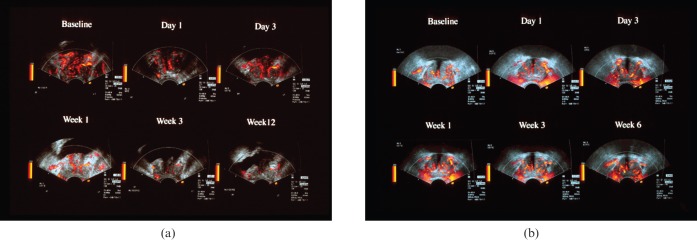
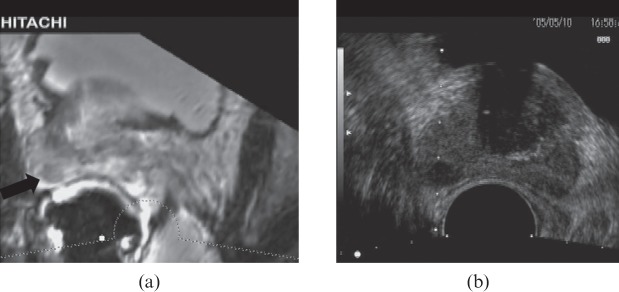
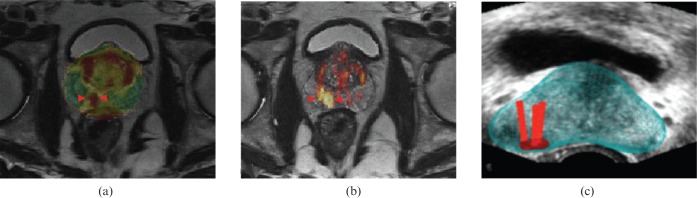
Transrectal ultrasound (TRUS) was first developed in the 1970s. TRUS-guided biopsy, under local anaesthetic and prophylactic antibiotics, is now the most widely accepted method to diagnose prostate cancer. However, the sensitivity and specificity of greyscale TRUS in the detection of prostate cancer is low. Prostate cancer most commonly appears as a hypoechoic focal lesion in the peripheral zone on TRUS but the appearances are variable with considerable overlap with benign lesions. Because of the low accuracy of greyscale TRUS, TRUS-guided biopsies have become established in the acquisition of systematic biopsies from standard locations. The number of systematic biopsies has increased over the years, with 10-12 cores currently accepted as the minimum standard. This article describes the technique of TRUS and biopsy and its complications. Novel modalities including contrast-enhanced modes and elastography as well as fusion techniques for increasing the sensitivity of TRUS-guided prostate-targeted biopsies are discussed along with their role in the diagnosis and management of prostate cancer.


Figures

Figure 1
Figure 1
Anatomy of the prostate gland and surrounding structures. (a, b) Axial and coronal views of the prostate gland and its close anatomical relationships. (c) Zonal model of the prostate. (d) Fascial planes around the prostate. A, artery; AFS, anterior fibromuscular stroma; CZ, central zone; ED, ejaculatory duct; N, nerve; PZ, peripheral zone; TZ, transition zone; U, urethra; V, vein. Reproduced with permission from [14].
Figure 2
Figure 2
Axial transrectal ultrasound (a–c) and longitudinal images of the normal prostate (d). CZ, central zone; ED, ejaculatory duct; NVB, neurovascular bundle; PZ, peripheral zone; SV, seminal vesicle; TZ transition zone; U, urethra; V, vas deferens.
Figure 3
Figure 3
Method of measurement of prostatic volume on axial (a) and sagittal planes (b).
Figure 4
Figure 4
The various methods for anaesthetising the prostate gland. In (1) the needle is positioned just outside the apex and the local anaesthetic is injected to create a pool around it. In (2) the injection has been made into Denonvilliers' fascia, just beyond the rectal wall. In (3) the local anaesthetic has been introduced around the neurovascular bundle, between the base of the gland and the seminal vesicle. Any of these sites can be used, as none is of proven superiority, but both sides should be injected for maximal effect. Reproduced with permission from [14].
Figure 5
Figure 5
Principles behind prostate biopsy. (a) The various biopsy schemes used, in the coronal plane. The first is the classic sextant pattern, which misses about 25% of cancers. The next three schemes illustrate the octant, 10-core and 12-core regimes, respectively. In current practice the 10- or 12-core regime is favoured. (b) Prostate biopsy is a systematic sampling technique and the diagram shows that the cores are preferentially targeted onto the peripheral zone as most cancers occur here. Note how the trajectories are aimed anterolaterally to maximise peripheral zone sampling. Reproduced with permission from [14].
Figure 6
Figure 6
A prostate cancer is seen as a focal echopoor lesion (arrow) with capsular invasion on axial transrectal ultrasound (a). T2 weighted axial MRI (b) confirms stage T3a with capsular invasion sparing the left seminal vesicle (arrow).
Figure 7
Figure 7
Transrectal ultrasound appearances suspicious for cancer. Reproduced with permission from [14].
Figure 8
Figure 8
Prostatitis mimicking carcinoma. A 68-year-old male with an incidental raised prostatic specific antigen level but no urinary symptoms. Axial transrectal ultrasound shows multifocal echopoor lesions with increased vascularity (arrows) that were thought to represent carcinoma sonographically. Biopsy revealed multifocal acute inflammation with no malignancy.
Figure 9
Figure 9
Common locations of prostate cancer. Reproduced with permission from [14].
Figure 10
Figure 10
Stage T3b right Gleason 4+4 cancer on axial transrectal ultrasound (a) showing seminal vesicle invasion (arrow), confirmed on axial T2 MRI (b).
Figure 11
Figure 11
Prostate cancer. (a) Greyscale transverse ultrasound section of a prostate with no focal abnormalities visible. (b) Power Doppler (unenhanced) of the same section shows a focal hypervascular area (arrow) demonstrated to be a carcinoma on biopsy. Reproduced with permission from [44].
Figure 12
Figure 12
Prostate cancer (arrows) in a patient with a prostatic specific antigen level of 3.46 shown on greyscale (a), colour Doppler (b), three-dimensional colour Doppler (c), seen as an area of increased stiffness on elastography (d) and as a focal enhancing lesion following intravenous Sonovue® (Bracco, Milan, Italy) microbubbles using microbubble-specific imaging (e). Biopsy confirmed a Gleason 7 (3+4) prostate cancer.
Figure 13
Figure 13
Transverse image of the prostate, following a bolus injection of microbubbles, with a low mechanical index mode (Micro Flow ImagingTM; Toshiba, Tokyo, Japan) showing regions of interest drawn on three areas in the prostate with their time–intensity curves above. Courtesy of Professor Fisher, Necker University Hospital, Paris, France. Reproduced with permission from [56].
Figure 14
Figure 14
Functional imaging of the prostate. (a) Axial B-mode ultrasound depicting a carcinoma (arrow). (b) Corresponding section of prostate with a functional overlay image (Toshiba, Tokyo, Japan) superimposed showing contrast medium bolus arrival time following an intravenous injection of microbubbles. The cancer (arrows) demonstrates an earlier arrival time than the rest of the prostate. The colour scale shows the arrival time in seconds. Reproduced with permission from [44].
Figure 15
Figure 15
Two cases of carcinoma of the prostate showing differential response to anti-androgen therapy on contrast-enhanced ultrasound. (a) Sequence of contrast-enhanced power Doppler images taken from the peak in enhancement at baseline and intervals after commencement of therapy. Note the marked decrease in signals after the first week indicating good response to therapy, which was observed clinically. (b) Sequence of contrast-enhanced power Doppler images of a different patient taken from the peak in enhancement at baseline and intervals after commencement of therapy. Note in this case the signals do not decrease over the treatment period. This patient escaped from hormonal control at 6-month review. Courtesy of Dr Eckersley, Department of Imaging, Hammersmith Hospital, London, UK. Reproduced with permission from [44].
Figure 16
Figure 16
MR transrectal ultrasound (TRUS) fusion image showing a prostate cancer on the MR image (a; black arrow) and biopsy being performed on the TRUS (b), seen as biopsy guidance lines.
Figure 17
Figure 17
MR transrectal ultrasound (TRUS) fusion image. (a, b) Multiparametric axial MR images with functional information (related to diffusion-weighted MRI) identifying a cancer (arrowheads) not visible on TRUS (study not shown). (c) Fused data set, superimposing after coregistration the MR images that identify the tumour based on its reduced diffusion onto the real-time TRUS images. The red bars represent biopsy trajectories. Biopsy directed by the TRUS revealed a Gleason 7 cancer. Courtesy of Dr Erik Rud, Oslo University Hospital, Oslo, Norway.

References

    1. Northern Ireland Cancer Registry Cancer incidence and mortality. Belfast, UK: NICR; 2010
    1. Welsh Cancer Intelligence and Surveillance Unit Cardiff, UK: WCISU; 2010
    1. ISD Online Information and Statistics Division, NHS Scotland Edinburgh, UK: ISD Scotland; 2010
    1. Office for National Statistics Registrations of cancer diagnosed in 2008, England. Series MB1 no. 39. London, UK: National Statistics; 2010
    1. Sakr WA, Grignon DJ, Haas GP, Heilbrun LK, Pontes JE, Crissman JD. Age and racial distribution of prostatic intraepithelial neoplasia. Eur Urol 1996;30:138–44 - PubMed