. 2012 Sep 1;189(5):2181-90.
doi: 10.4049/jimmunol.1103545. Epub 2012 Jul 27.

Impaired humoral immunity and tolerance in K14-VEGFR-3-Ig mice that lack dermal lymphatic drainage

Affiliations

Impaired humoral immunity and tolerance in K14-VEGFR-3-Ig mice that lack dermal lymphatic drainage

Susan N Thomas et al. J Immunol. .

Abstract

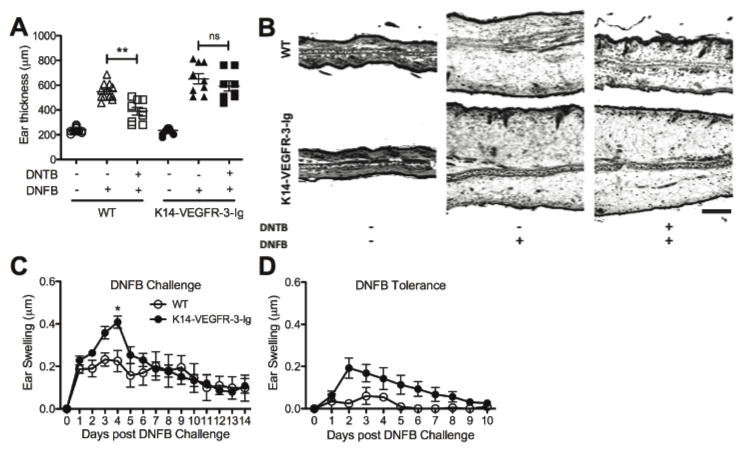
Lymphatic vessels transport interstitial fluid, soluble Ag, and immune cells from peripheral tissues to lymph nodes (LNs), yet the contribution of peripheral lymphatic drainage to adaptive immunity remains poorly understood. We examined immune responses to dermal vaccination and contact hypersensitivity (CHS) challenge in K14-VEGFR-3-Ig mice, which lack dermal lymphatic capillaries and experience markedly depressed transport of solutes and dendritic cells from the skin to draining LNs. In response to dermal immunization, K14-VEGFR-3-Ig mice produced lower Ab titers. In contrast, although delayed, T cell responses were robust after 21 d, including high levels of Ag-specific CD8+ T cells and production of IFN-γ, IL-4, and IL-10 upon restimulation. T cell-mediated CHS responses were strong in K14-VEGFR-3-Ig mice, but importantly, their ability to induce CHS tolerance in the skin was impaired. In addition, 1-y-old mice displayed multiple signs of autoimmunity. These data suggest that lymphatic drainage plays more important roles in regulating humoral immunity and peripheral tolerance than in effector T cell immunity.


Figures

Figure 1
Figure 1. Reduced lymphatic drainage and dendritic cell transport to lymph nodes and abnormal architecture in skin-draining lymph nodes of K14-VEGFR-3-Ig mice
(A) Lymphatic uptake after intradermal injection into the tail representing volume of fluid drained per tissue volume per time and pressure gradient, normalized to wildtype (WT) mice; n=6–7. Representative flow cytometry plots (B) and quantification of dendritic cell (DC) trafficking from periphery to lymph node (LN) after FITC painting (C) or intradermal injection of 1 μm YG polystyrene microspheres (D); n=4–7. (E) Steady state Langerin+ cell numbers in the dermal-draining LN. (F–H) Immunohistochemistry of dermal-draining LN (brachial and inguinal) and mesenteric-draining LN sections stained for (F) B cells (B220, red), T cells (CD3ε, green), and dendritic cells (CD11c, blue); (G–H) fibroblastic reticular cells (ER-TR7; G, green; H, red), and (H) high endothelial venules (peripheral node addressin ((PNAd); green). Scale bars: (F) top, 200 μm; middle, 50 μm; bottom, 100 μm, (G) 300 μm, (H) 20 μm. (I) Relative expression of PNAd in high endothelial venules from immunostaining. * p < 0.05 by Mann-Whitney.
Figure 2
Figure 2. Altered immune cell distributions in lymph nodes of K14-VEGFR-3-Ig mice
(A) Relative distributions of CD11c+ dendritic cells, F4/80+ macrophages, B220+ B cells, and lymphocytes (CD3ε+) in the dermal and mesenteric lymph nodes, spleen, and blood. (B) Distributions of lymphocyte subtypes in each compartment as indicated show more CD4 and less CD8 T cells in transgenic (TG) vs. wildtype mice. (C) Distributions of regulatory T cells in each compartment. (D) Normalized mean fluorescence intensity (MFI) of CD19 expression by cells in each compartment. n=4–12. (A–B, D) * p < 0.01, ** p < 0.01. (C) * p < 0.05 for CD25 cells,** p < 0.01 for both CD25+ and CD25 cells.
Figure 3
Figure 3. Minimal antibody responses to dermal vaccination but normal ex vivo B cell function in K14-VEGFR-3-Ig mice
(A–C) Ovalbumin (OVA)-specific serum antibodies 21 days after OVA immununization: (A) total IgG, (B) IgG2c and (C) IgG1 titers. * p < 0.05, ** p < 0.01 using Mann-Whitney; n=5–11. (D–F) B cells isolated from dLNs and spleens of K14-VEGFR-3-Ig and WT mice respond similarly to 24h LPS stimulation ex vivo. (D) Differences in CD86 mean fluorescence intensity (MFI) and (E) IFN-γ or (F) IgM secretion (stimulated cells less unstimulated cells) as measured by ELISA. p values by Mann-Whitney.
Figure 4
Figure 4. Robust Ag-specific T cell responses to dermal immunization in K14-VEGFR-3-Ig mice
21 days p.i. with ovalbumin (OVA), splenocytes were isolated and restimulated with and without OVA. (A) IFN-γ, (B) IL-4, and (C) IL-10 production by splenocytes with 110h OVA restimulation less cytokine production by unstimulated cells. (D) Frequencies of antigen-specific (SIINFEKL pentamer+) CD8+ splenic T cells. n=5–12.
Figure 5
Figure 5. T cell priming after immunization in K14-VEGFR-3-Ig mice is delayed
(A–B) The number of OT-I and (C–D) OT-II cells responding to immunization quantified as the (A, C) total numbers of cells in each generation (G) or as (B, D) the percentage of unproliferated cells (determined by calculating the number of cells in each generation, normalized by the number of divisions, to determine the total) post-immunization with OVA+LPS in the spleen and dLNs. Initial OT-I and OT-II cell priming in WT (i, iii) and K14-VEGFR-3-Ig (ii, iv) mice, respectively. * p < 0.05, ** p < 0.01 using two-way ANOVA; n=3.
Figure 6
Figure 6. K14-VEGFR-3-Ig mouse ears swell in response to dermal contact hypersensitivity challenge but cannot be pre-tolerized
(A) Ear swelling 48 h after epicutaneous application of 0.3% DNFB five days after DNFB sensitization. Alternatively, tolerance to DNFB challenge, induced by epicutaneous DNTB treatment performed 7d before DNFB sensitization, was seen in control mice, but not in transgenic mice. (B) Hematoxylin and eosin stained cross-sections of ears 48 h after challenge. Bar, 200 μm. * p<0.05, ** p<0.01; n=8–12. Resolution of ear swelling in (C) DNFB challenge and (D) DNFB tolerance experiments.
Figure 7
Figure 7. One-year-old K14-VEGFR-3-Ig mice display autoimmune phenotypes
(A) Increased IgG1, IgG3 and IgA mAb isotypes in serum of K14-VEGFR-3-Ig mice. (B–C) Increased frequencies of spleen-resident megakaryocytes (black arrowheads) by HE staining. Bar, 50 μm. (D) Increased serum titers of dsDNA-reactive Ig. (E) Antibody deposition (red) in the skin. (F–G) Frequencies of mice with serum reactive towards indicated mouse tissues. n=5–12. * p<0.05, ** p<0.01 by Mann-Whitney. # p<0.05 determined by Fisher’s exact test.

References

    1. Friedlaender MH, Baer H. Immunologic tolerance: role of the regional lymph node. Science. 1972;176:312–314. - PubMed
    1. Friedlaender MH, Chisari FV, Baer H. The role of the inflammatory response of skin and lymph nodes in the induction of sensitization to simple chemicals. J Immunol. 1973;111:164–170. - PubMed
    1. Hintzen G, Ohl L, del Rio ML, Rodriguez-Barbosa JI, Pabst O, Kocks JR, Krege J, Hardtke S, Forster R. Induction of tolerance to innocuous inhaled antigen relies on a CCR7-dependent dendritic cell-mediated antigen transport to the bronchial lymph node. J Immunol. 2006;177:7346–7354. - PubMed
    1. Reynoso ED, Lee JW, Turley SJ. Peripheral tolerance induction by lymph node stroma. In: Schoenberger SP, Katsikis PD, Pulendran B, editors. Crossroads between Innate and Adaptive Immunity Ii. 2009. pp. 113–127.
    1. Baird JB, Charles JL, Streit TG, Roberts JM, Addiss DG, Lammie PJ. Reactivity to bacterial, fungal, and parasite antigens in patients with lymphedema and elephantiasis. Am J Trop Med Hyg. 2002;66:163–169. - PubMed

Publication types

MeSH terms

Substances