. 2012;7(7):e41079.
doi: 10.1371/journal.pone.0041079. Epub 2012 Jul 26.

Bacteroides uniformis CECT 7771 ameliorates metabolic and immunological dysfunction in mice with high-fat-diet induced obesity

Affiliations

Bacteroides uniformis CECT 7771 ameliorates metabolic and immunological dysfunction in mice with high-fat-diet induced obesity

Paola Gauffin Cano et al. PLoS One. 2012.

Abstract

Background: Associations have been made between obesity and reduced intestinal numbers of members of the phylum Bacteroidetes, but there is no direct evidence of the role these bacteria play in obesity. Herein, the effects of Bacteroides uniformis CECT 7771 on obesity-related metabolic and immune alterations have been evaluated.

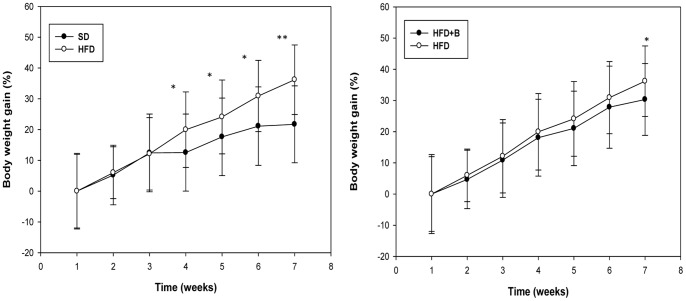
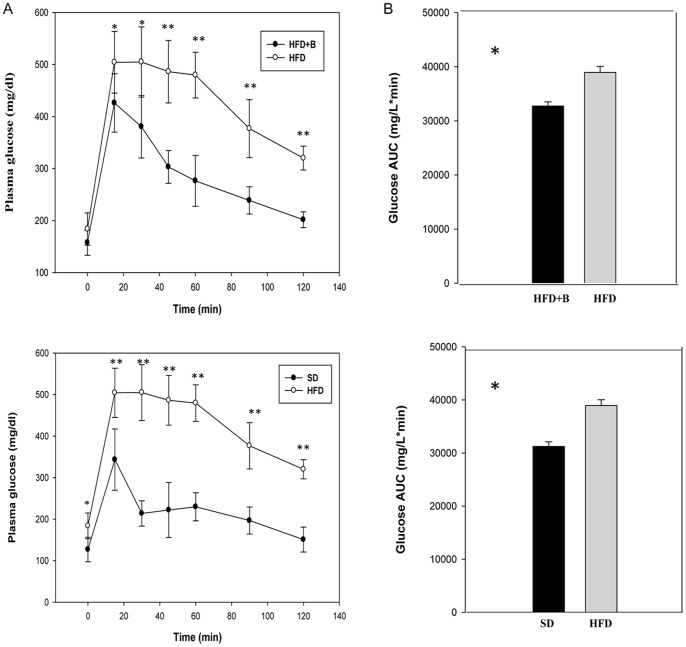
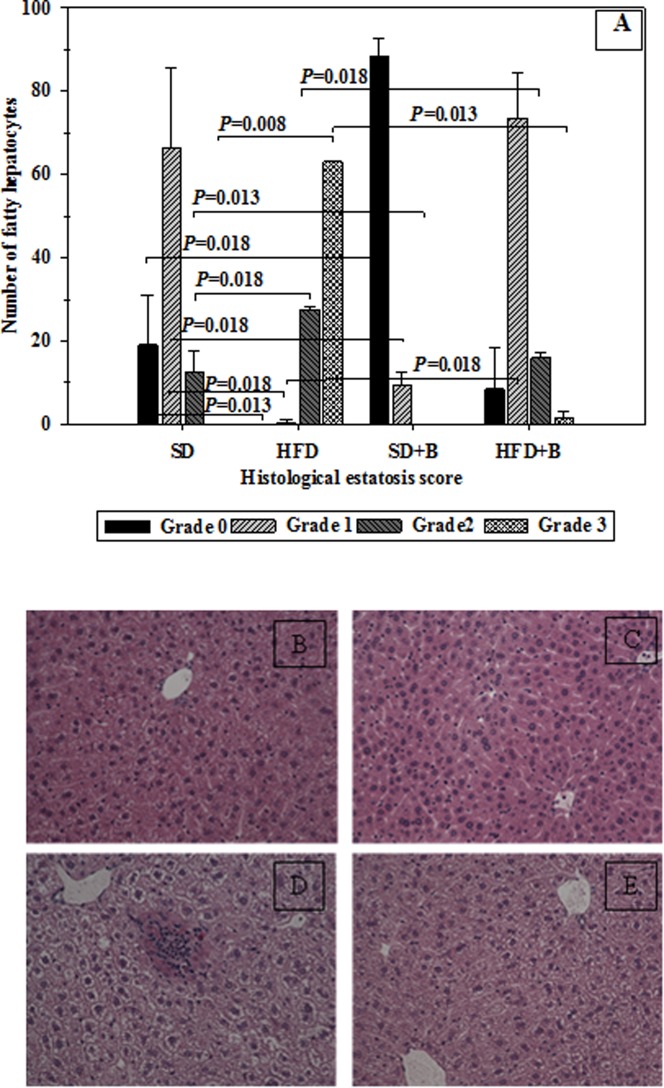
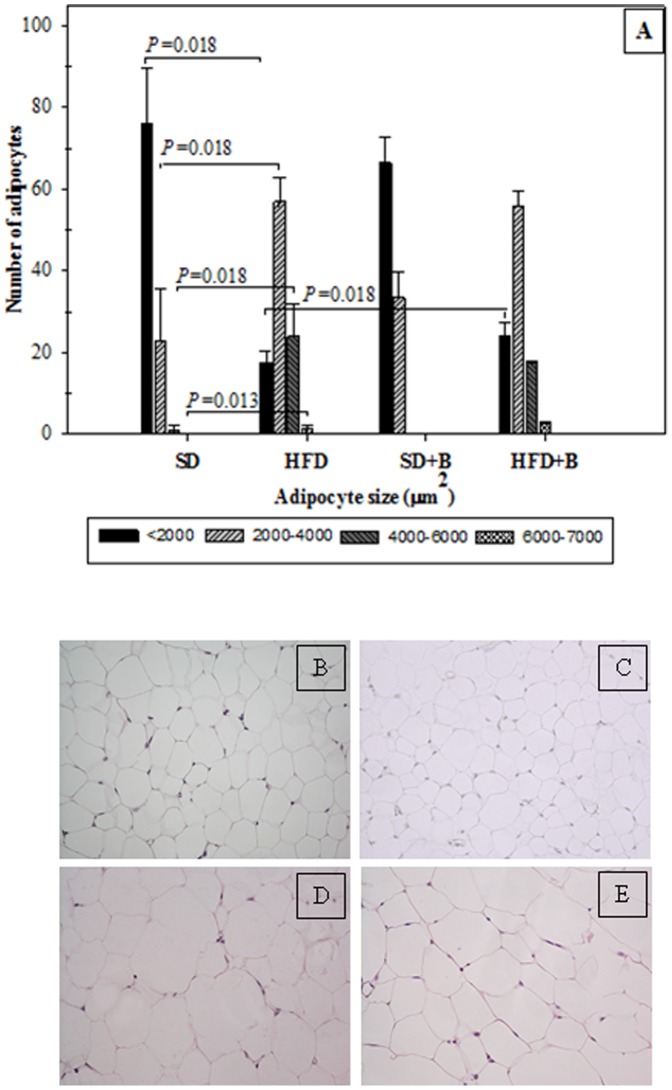
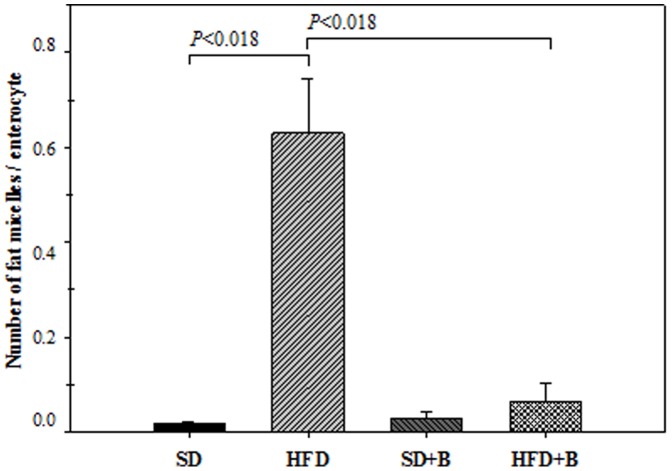
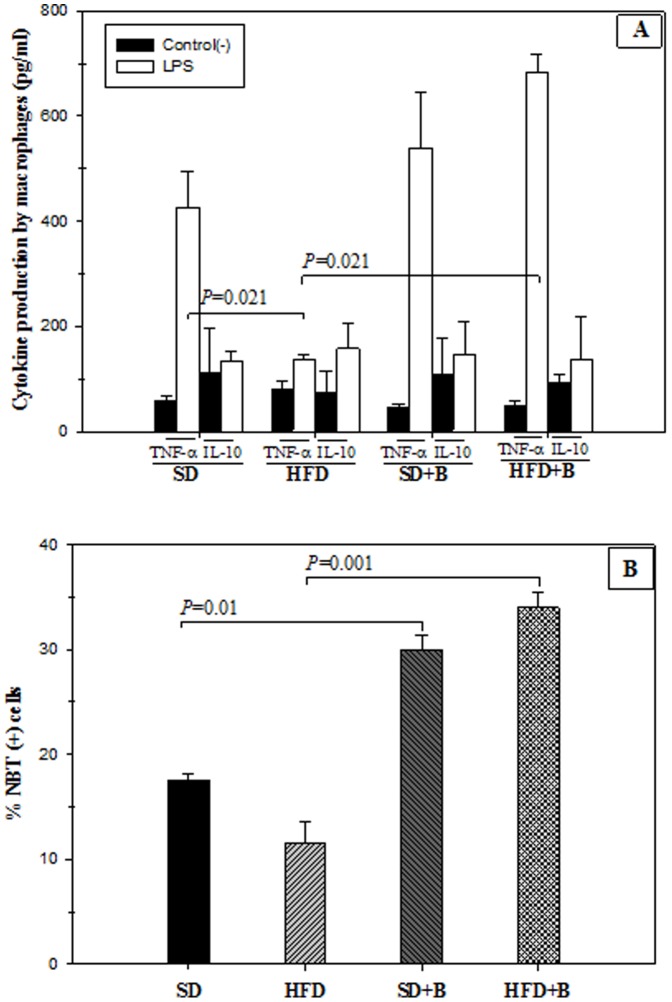
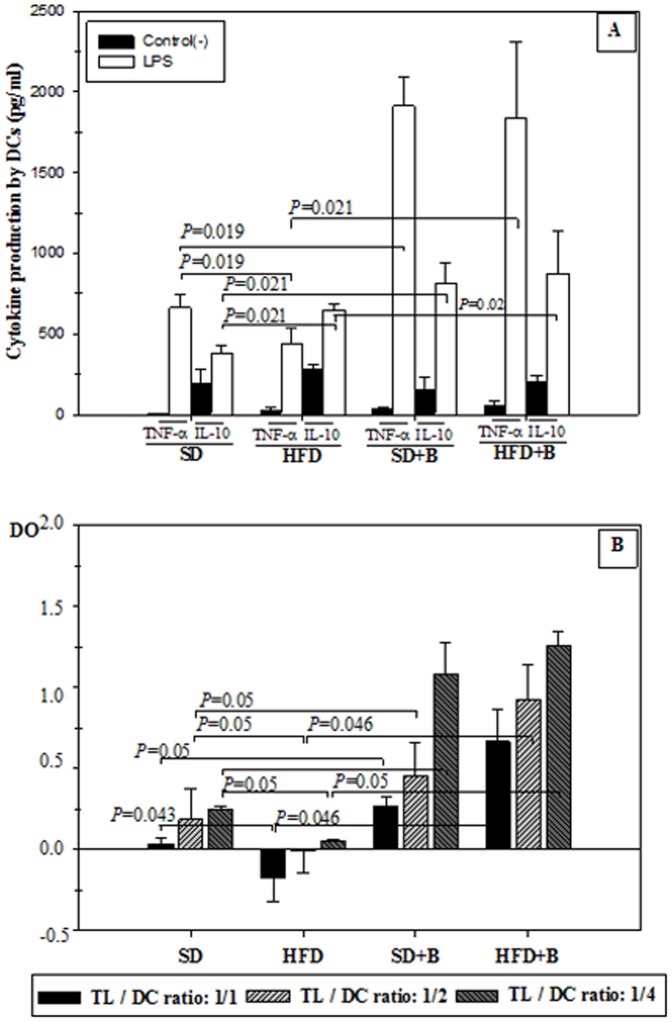
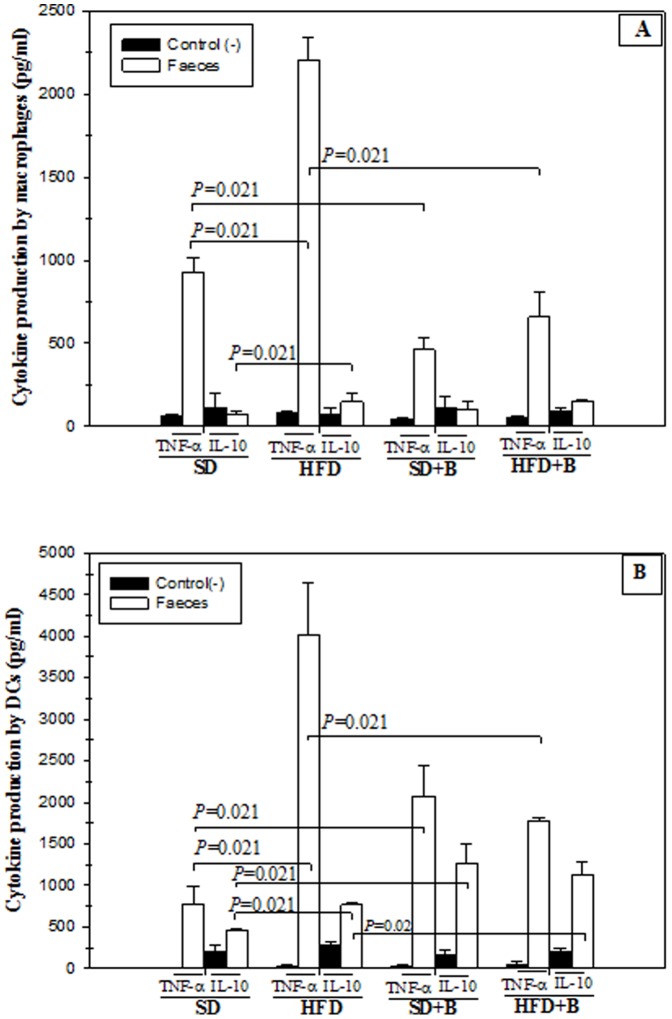
Methods and findings: Adult (6-8 week) male wild-type C57BL-6 mice were fed a standard diet or a high-fat-diet HFD to induce obesity, supplemented or not with B. uniformis CECT 7771 for seven weeks. Animal weight was monitored and histologic, biochemical, immunocompetent cell functions, and features of the faecal microbiota were analysed after intervention. The oral administration of B. uniformis CECT 7771 reduced body weight gain, liver steatosis and liver cholesterol and triglyceride concentrations and increased small adipocyte numbers in HFD-fed mice. The strain also reduced serum cholesterol, triglyceride, glucose, insulin and leptin levels, and improved oral tolerance to glucose in HFD fed mice. The bacterial strain also reduced dietary fat absorption, as indicated by the reduced number of fat micelles detected in enterocytes. Moreover, B. uniformis CECT 7771 improved immune defence mechanisms, impaired in obesity. HFD-induced obesity led to a decrease in TNF-α production by peritoneal macrophages stimulated with LPS, conversely, the administration of B. uniformis CECT 7771 increased TNF-α production and phagocytosis. Administering this strain also increased TNF-α production by dendritic cells (DCs) in response to LPS stimulation, which was significantly reduced by HFD. B. uniformis CECT 7771 also restored the capacity of DCs to induce a T-cell proliferation response, which was impaired in obese mice. HFD induced marked changes in gut microbiota composition, which were partially restored by the intervention.

Conclusions: Altogether, the findings indicate that administration of B. uniformis CECT 7771 ameliorates HFD-induced metabolic and immune dysfunction associated with intestinal dysbiosis in obese mice.


Conflict of interest statement

Competing Interests: The authors have declared that no competing interests exist.

Figures

Figure 1
Figure 1. Time course of relative body weight gain in control mice and mice with high fat diet-induced obesity, administered or not B. uniformis CECT 7771.
SD: standard diet group (control) (n = 6); HFD: high fat diet group (n = 6); HFD+B: high fat diet group receiving a daily dose of 5.0×10⁸ CFU B. uniformis CECT 7771 by gavage for 7 weeks (n = 6).
Figure 2
Figure 2. Glucose tolerance in control mice and mice with high fat diet-induced obesity, administered or not B. uniformis CECT 7771.
SD: standard diet group (control) (n = 6); HFD: high fat diet group (n = 6); HFD+B: high fat diet group receiving a daily dose of 5.0×10⁸ CFU B. uniformis CECT 7771 by gavage for 7 weeks (n = 6). A: Plasma glucose profile following 2 g/kg glucose oral challenge after 4 h fasting; B: Mean area under the curve measured between 0 and 120 min after glucose administration.
Figure 3
Figure 3. Determination of hepatic steatosis (hepatic histology) in control mice and mice with high fat diet-induced obesity, administered or not B. uniformis CECT 7771.
SD: standard diet group (control) (n = 6); SD+B: standard diet group receiving a daily dose of 5.0×10⁸ CFU B. uniformis CECT 7771 by gavage for 7 weeks (n = 6); HFD: high fat diet group (n = 6); HFD+B: high fat diet group receiving a daily dose of 5.0×10⁸ CFU B. uniformis CECT 7771 by gavage for 7 weeks (n = 6).The fat vacuoles were measured in 100 hepatocytes of two liver tissue sections per mouse and scored for the severity of steatosis according to the following criteria: For grade-0 steatosis, no fatty hepatocytes; grade-1 steatosis, fat occupying less than 30% of the hepatocyte; grade-2 steatosis, fat occupying less than 30 to 60% of the hepatocyte; grade-3 steatosis, fat occupying more than 60% of the hepatocyte. Photomicrographs 20X of representative HE-stained slides are shown. (B) SD group, (C) SD+P group, (D) HFD group and (F) HFD+P group. Data are expressed as means ± SD and statistically significant differences are established at P<0.05.
Figure 4
Figure 4. Distribution of adipocyte size in epididymal adipose tissue in control mice and mice with high fat diet-induced obesity, administered or not B. uniformis CECT 7771.
SD: standard diet group (control) (n = 6); SD+B: standard diet group receiving a daily dose of 5.0×10⁸ CFU B. uniformis CECT 7771 by gavage for 7 weeks (n = 6); HFD: high fat diet group (n = 6); HFD+B: high fat diet group receiving a daily dose of 5.0×10⁸ CFU B. uniformis CECT 7771 by gavage for 7 weeks (n = 6). Adipocyte cell sizes were expressed as area ranges and were the following: <2000, 2000–4000, 4000–6000 and 6000–7000 µm2. Data are expressed as means ± SD and statistically significant differences are established at P<0.05. Photomicrographs 20X of representative HE-stained slides are shown. (B) SD group, (C) SD+B group, (D) HFD group and (E) HFD+B group.
Figure 5
Figure 5. Number of fat micelles per enterocyte in control mice and mice with high fat diet-induced obesity, administered or not B. uniformis CECT 7771.
SD: standard diet group (control) (n = 6); SD+B: standard diet group receiving a daily dose of 5.0×10⁸ CFU B. uniformis CECT 7771 by gavage for 7 weeks (n = 6); HFD: high fat diet group (n = 6); HFD+B: high fat diet group receiving a daily dose of 5.0×10⁸ CFU B. uniformis CECT 7771 by gavage for 7 weeks (n = 6). The relation fat micelles/enterocyte was determined in 100 cells from two sections of the small intestine of each mouse by counting ten 100X light microscope fields. Data are expressed as means ± SD and statistically significant differences are established at P<0.05.
Figure 6
Figure 6. Cytokine production in LPS-stimulated peritoneal macrophages and phagocytosis function of control mice and mice with high-fat diet induced obesity, administered or not B. uniformis CECT 7771.
SD: standard diet group (control) (n = 6); SD+B: standard diet group receiving a daily dose of 5.0×10⁸ CFU B. uniformis CECT 7771 by gavage for 7 weeks (n = 6); HFD: high fat diet group (n = 6); HFD+B: high fat diet group receiving a daily dose of 5.0×10⁸ CFU B. uniformis CECT 7771 by gavage for 7 weeks (n = 6). In the cytokine production study, peritoneal macrophages were stimulated with purified lipopolysaccharide (LPS) from S. enterica serotype Typhimurium (Figure 6A). Non-stimulated peritoneal macrophages were evaluated as controls of basal cytokine levels. In the phagocytosis study (Figure 6B), evidence of oxygen-radical production by macrophages was determined by the NBT test after in vitro interaction with a bacterial extract. Figure 6A: TNF- α and IL-10 cytokines produced by LPS-stimulated macrophages; Figure 6B: % NBT (+) cells. Data are expressed as mean and standard deviation of duplicate measurements determined in two independent experiments. Statistically significant differences of data are established at P<0.05.
Figure 7
Figure 7. Influence of LPS stimuli on cytokine production and activation of T-lymphocyte proliferation by dendritic cells (DCs) generated from control mice and mice with high-fat diet induced obesity, administered or not B. uniformis CECT 777.
SD: standard diet group (control) (n = 6); SD+B: standard diet group receiving a daily dose of 5.0×10⁸ CFU B. uniformis CECT 7771 by gavage for 7 weeks (n = 6); HFD: high fat diet group (n = 6); HFD+B: high fat diet group receiving a daily dose of 5.0×10⁸ CFU B. uniformis CECT 7771 by gavage for 7 weeks (n = 6). In the cytokine production study, DCs were stimulated with purified lipopolysaccharide (LPS) from S. enterica serotype Typhimurium (Figure 7A). Non-stimulated DCs were evaluated as controls of basal cytokine levels. In the lymphocyte proliferation study (Figure 7B), matured DCs were used for priming a T-cell proliferative response at the following LT/CD ratios: 1∶1, 1∶2, 1∶4. Lymphocyte proliferation was measured with the cell proliferation ELISA BrdU-colorimetric assay. Figure 7A: TNF- α and IL-10 cytokines produced by LPS-stimulated CDs; Figure 7B: Lymphocyte proliferation. Data are expressed as means ± SD of duplicate measures determined in two independent experiments. Statistically significant differences of data are established at P<0.05.
Figure 8
Figure 8. Influence of stool samples from mice fed standard diet or high-fat diet, supplemented or not with B. uniformis CECT 7771, on cytokine production by peritoneal macrophages and dendritic cells (DCs) from control mice.
SD: standard diet group (control) (n = 6); SD+B: standard diet group receiving a daily dose of 5.0×10⁸ CFU B. uniformis CECT 7771 by gavage for 7 weeks (n = 6); HFD: high fat diet group (n = 6); HFD+B: high fat diet group receiving a daily dose of 5.0×10⁸ CFU B. uniformis CECT 7771 by gavage for 7 weeks (n = 6). In the cytokine production study, peritoneal macrophages (Figure 8A) and DCs (Figure 8B) were stimulated with stool stimuli. Non-stimulated peritoneal macrophages and DCs were evaluated as controls of basal cytokine levels. Figure 8A: TNF- α and IL-10 cytokines produced by stool-stimulated peritoneal macrophages; Figure 8B: TNF- α and IL-10 cytokines produced by stool-stimulated CDs. Data are expressed as means ± SD of duplicate measures determined in two independent experiments. Statistically significant differences of data are established at P<0.05.

References

    1. Moreno LA, Mesana MI, Gonzalez-Gross M, Gil CM, Fleta J, et al. (2006) Anthropometric body fat composition reference values in Spanish adolescents. The AVENA Study. Eur J Clin Nutr 60: 191–196. - PubMed
    1. Badman MK, Flier JS (2007) The adipocyte as an active participant in energy balance and metabolism. Gastroenterology 132: 2103–2115. - PubMed
    1. Sanz Y, Santacruz A, Gauffin P (2010) Gut microbiota in obesity and metabolic disorders. Proc Nutr Soc 69: 434–441. - PubMed
    1. Wolowczuk I, Verwaerde C, Viltart O, Delanoye A, Delacre M, et al. (2008) Feeding our immune system: impact on metabolism. Clin Dev Immunol 2008: 639803. - PMC - PubMed
    1. Verwaerde C, Delanoye A, Macia L, Tailleux A, Wolowczuk I (2006) Influence of high-fat feeding on both naive and antigen-experienced T-cell immune response in DO10.11 mice. Scand J Immunol 64: 457–466. - PubMed

Publication types

MeSH terms