

Insulin-increased L-arginine transport requires A(2A) adenosine receptors activation in human umbilical vein endothelium
- PMID: 22844517
- PMCID: PMC3402464
- DOI: 10.1371/journal.pone.0041705
Insulin-increased L-arginine transport requires A(2A) adenosine receptors activation in human umbilical vein endothelium
Abstract
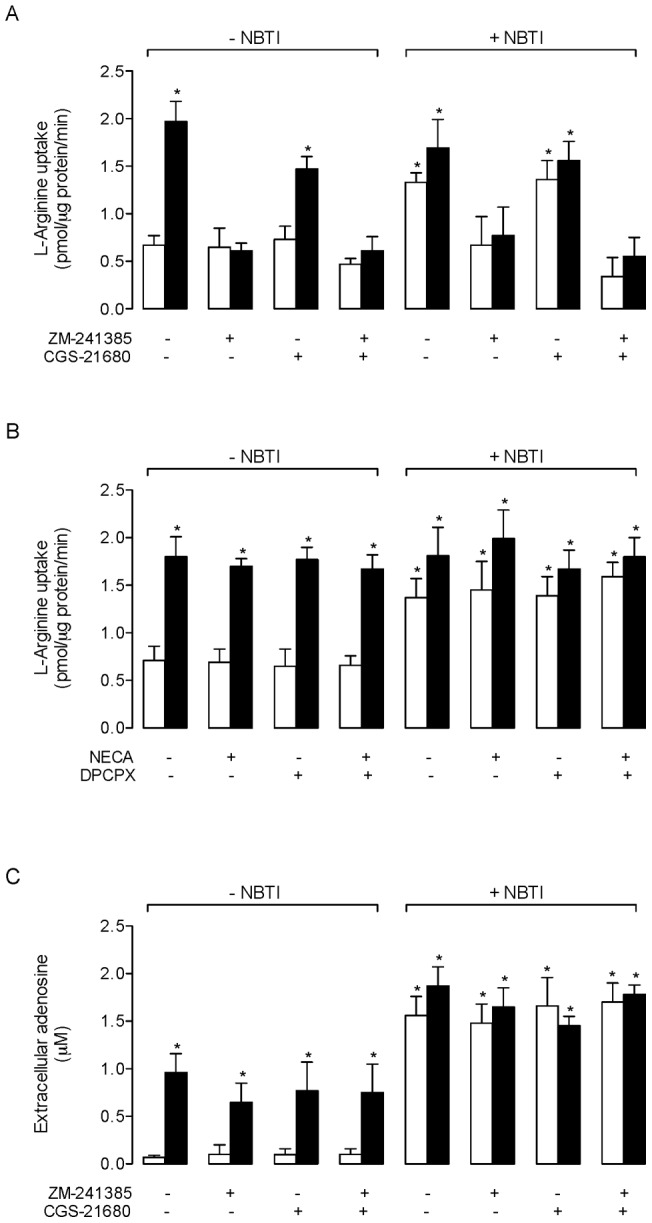
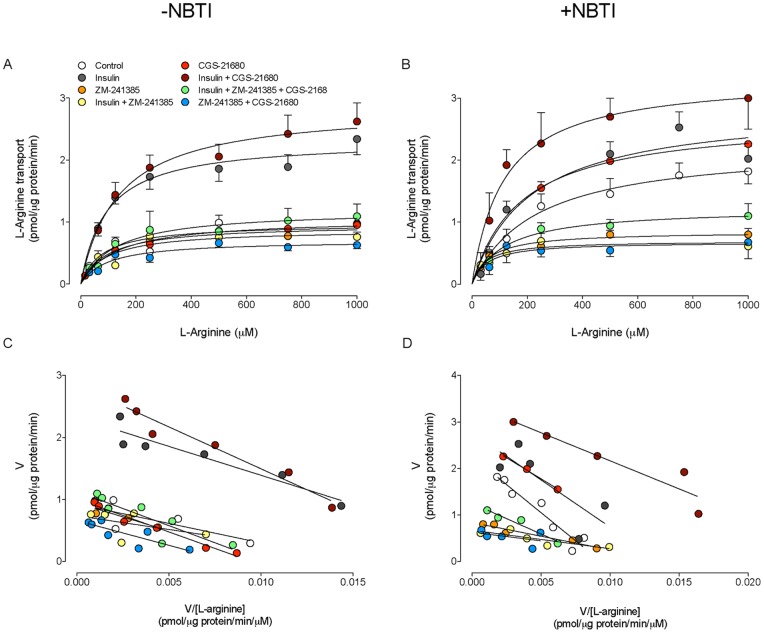
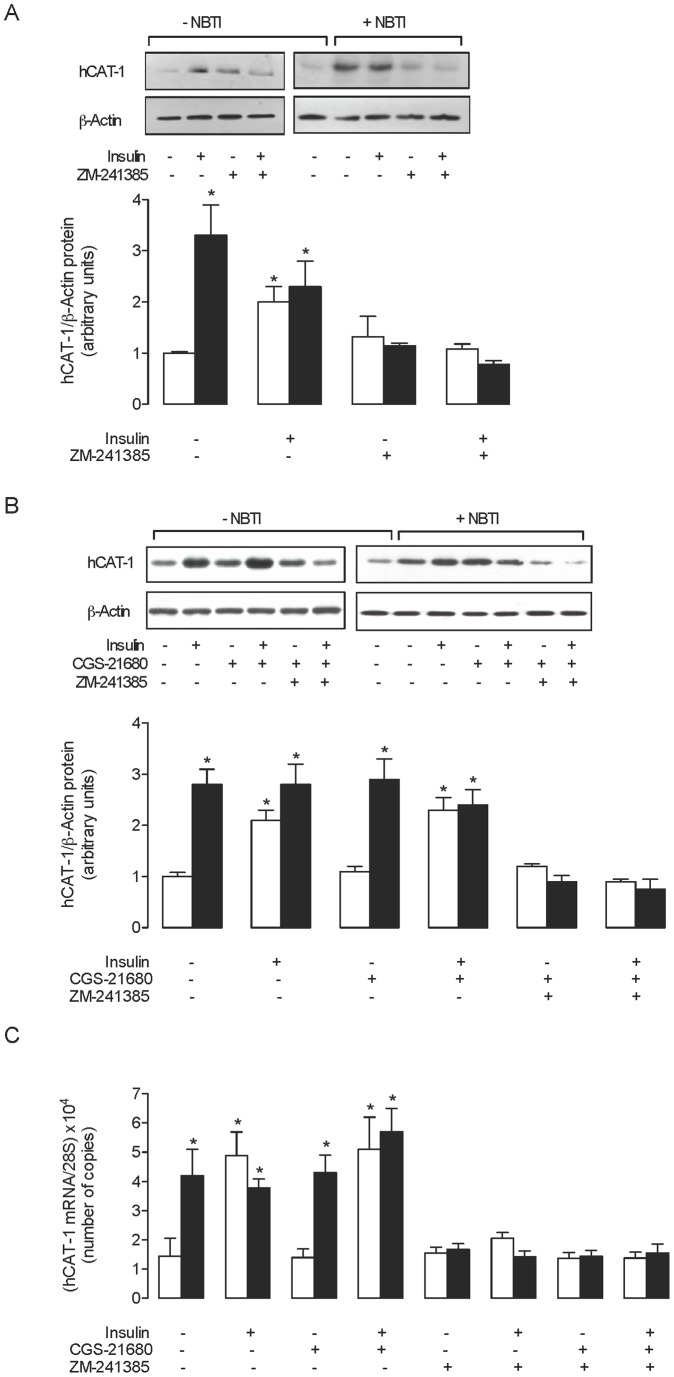
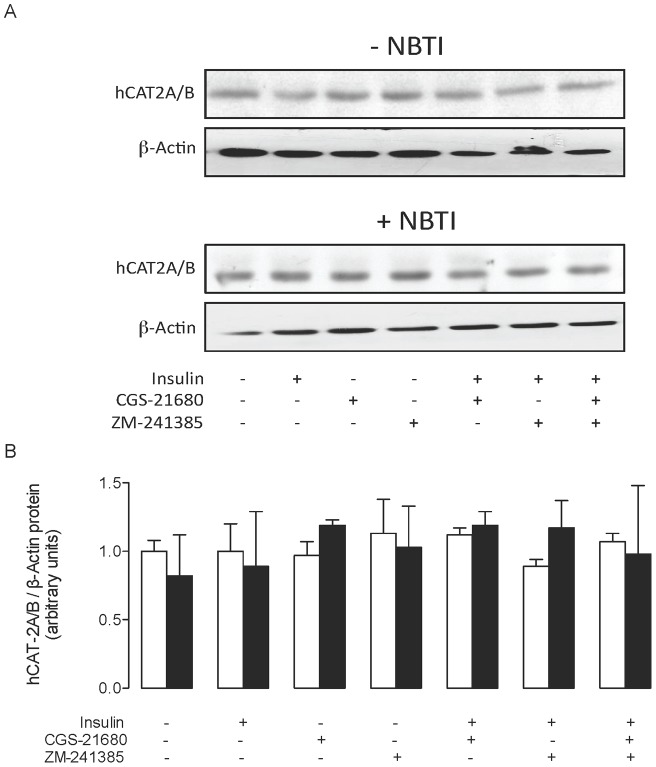
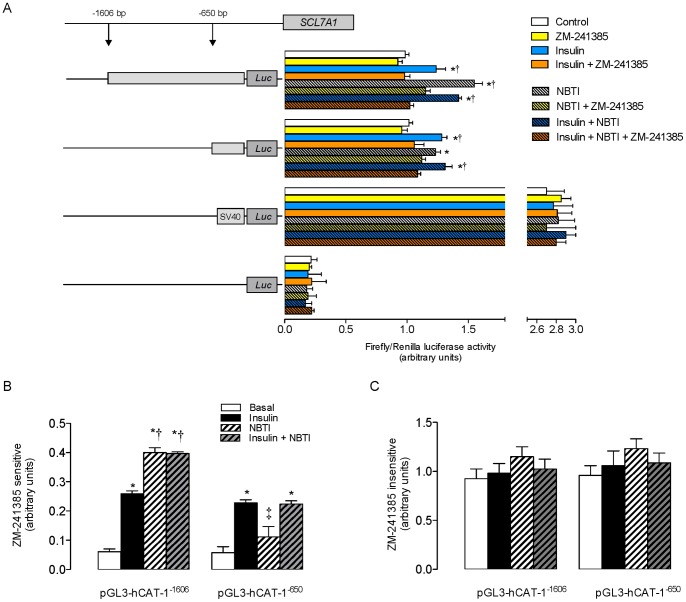
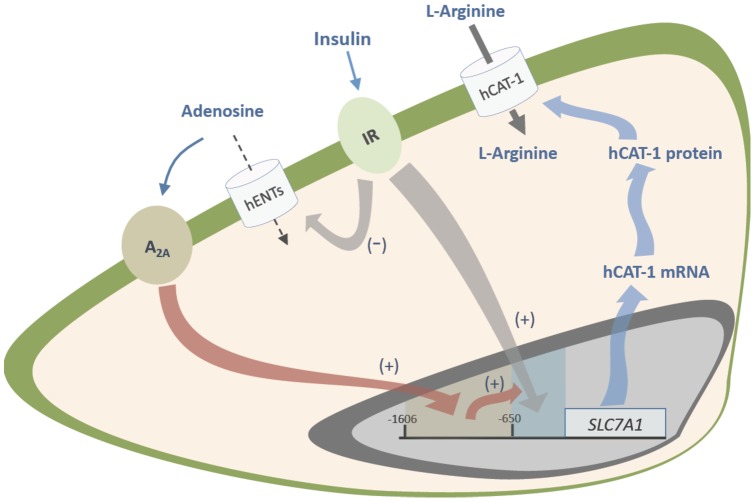
Adenosine causes vasodilation of human placenta vasculature by increasing the transport of arginine via cationic amino acid transporters 1 (hCAT-1). This process involves the activation of A(2A) adenosine receptors (A(2A)AR) in human umbilical vein endothelial cells (HUVECs). Insulin increases hCAT-1 activity and expression in HUVECs, and A(2A)AR stimulation increases insulin sensitivity in subjects with insulin resistance. However, whether A(2A)AR plays a role in insulin-mediated increase in L-arginine transport in HUVECs is unknown. To determine this, we first assayed the kinetics of saturable L-arginine transport (1 minute, 37°C) in the absence or presence of nitrobenzylthioinosine (NBTI, 10 µmol/L, adenosine transport inhibitor) and/or adenosine receptors agonist/antagonists. We also determined hCAT-1 protein and mRNA expression levels (Western blots and quantitative PCR), and SLC7A1 (for hCAT-1) reporter promoter activity. Insulin and NBTI increased the extracellular adenosine concentration, the maximal velocity for L-arginine transport without altering the apparent K(m) for L-arginine transport, hCAT-1 protein and mRNA expression levels, and SLC7A1 transcriptional activity. An A2AAR antagonist ZM-241385 blocked these effects. ZM241385 inhibited SLC7A1 reporter transcriptional activity to the same extent in cells transfected with pGL3-hCAT-1(-1606) or pGL3-hCAT-1(-650) constructs in the presence of NBTI + insulin. However, SLC7A1 reporter activity was increased by NBTI only in cells transfected with pGL3-hCAT-1(-1606), and the ZM-241385 sensitive fraction of the NBTI response was similar in the absence or in the presence of insulin. Thus, insulin modulation of hCAT-1 expression and activity requires functional A(2A)AR in HUVECs, a mechanism that may be applicable to diseases associated with fetal insulin resistance, such as gestational diabetes.
Conflict of interest statement
Figures
Similar articles
-
Insulin requires A1 adenosine receptors expression to reverse gestational diabetes-increased L-arginine transport in human umbilical vein endothelium.Purinergic Signal. 2016 Mar;12(1):175-90. doi: 10.1007/s11302-015-9491-2. Epub 2015 Dec 28. Purinergic Signal. 2016. PMID: 26710791 Free PMC article.
-
Insulin restores L-arginine transport requiring adenosine receptors activation in umbilical vein endothelium from late-onset preeclampsia.Placenta. 2015 Mar;36(3):287-96. doi: 10.1016/j.placenta.2014.12.007. Epub 2014 Dec 20. Placenta. 2015. PMID: 25573092
-
Insulin-stimulated L-arginine transport requires SLC7A1 gene expression and is associated with human umbilical vein relaxation.J Cell Physiol. 2011 Nov;226(11):2916-24. doi: 10.1002/jcp.22635. J Cell Physiol. 2011. PMID: 21302286
-
A role for insulin on L-arginine transport in fetal endothelial dysfunction in hyperglycaemia.Curr Vasc Pharmacol. 2009 Oct;7(4):467-74. doi: 10.2174/157016109789043919. Curr Vasc Pharmacol. 2009. PMID: 19485892 Review.
-
Role of insulin, adenosine, and adipokine receptors in the foetoplacental vascular dysfunction in gestational diabetes mellitus.Biochim Biophys Acta Mol Basis Dis. 2020 Feb 1;1866(2):165370. doi: 10.1016/j.bbadis.2018.12.021. Epub 2019 Jan 17. Biochim Biophys Acta Mol Basis Dis. 2020. PMID: 30660686 Review.
Cited by
-
Identification of placental nutrient transporters associated with intrauterine growth restriction and pre-eclampsia.BMC Genomics. 2018 Mar 2;19(1):173. doi: 10.1186/s12864-018-4518-z. BMC Genomics. 2018. PMID: 29499643 Free PMC article.
-
The Adenosinergic System as a Therapeutic Target in the Vasculature: New Ligands and Challenges.Molecules. 2017 May 6;22(5):752. doi: 10.3390/molecules22050752. Molecules. 2017. PMID: 28481238 Free PMC article. Review.
-
Diseases of pregnancy and fetal programming: cell and molecular mechanisms.Biomed Res Int. 2014;2014:937050. doi: 10.1155/2014/937050. Epub 2014 Nov 10. Biomed Res Int. 2014. PMID: 25431769 Free PMC article. No abstract available.
-
Enhanced A2A adenosine receptor-mediated increase in coronary flow in type I diabetic mice.J Mol Cell Cardiol. 2016 Jan;90:30-7. doi: 10.1016/j.yjmcc.2015.11.033. Epub 2015 Dec 2. J Mol Cell Cardiol. 2016. PMID: 26654777 Free PMC article.
-
Insulin requires A1 adenosine receptors expression to reverse gestational diabetes-increased L-arginine transport in human umbilical vein endothelium.Purinergic Signal. 2016 Mar;12(1):175-90. doi: 10.1007/s11302-015-9491-2. Epub 2015 Dec 28. Purinergic Signal. 2016. PMID: 26710791 Free PMC article.
References
-
- Guzmán-Gutiérrez E, Abarzúa F, Belmar C, Nien JK, Ramírez MA, et al. Functional link between adenosine and insulin: a hypothesis for fetoplacental vascular endothelial dysfunction in gestational diabetes. Curr Vasc Pharmacol. 2011;9:750–762. - PubMed
-
- Leiva A, Pardo F, Ramírez MA, Farías M, Casanello P, et al. Fetoplacental vascular endothelial dysfunction as an early phenomenon in the programming of human adult diseases in subjects born from gestational diabetes mellitus or obesity in pregnancy. Exp Diabetes Res. 2011;2011:349286. - PMC - PubMed
Publication types
MeSH terms
Substances
LinkOut - more resources
Full Text Sources
Medical
Research Materials
