

Effect of reference genome selection on the performance of computational methods for genome-wide protein-protein interaction prediction
- PMID: 22844541
- PMCID: PMC3406042
- DOI: 10.1371/journal.pone.0042057
Effect of reference genome selection on the performance of computational methods for genome-wide protein-protein interaction prediction
Abstract
Background: Recent progress in computational methods for predicting physical and functional protein-protein interactions has provided new insights into the complexity of biological processes. Most of these methods assume that functionally interacting proteins are likely to have a shared evolutionary history. This history can be traced out for the protein pairs of a query genome by correlating different evolutionary aspects of their homologs in multiple genomes known as the reference genomes. These methods include phylogenetic profiling, gene neighborhood and co-occurrence of the orthologous protein coding genes in the same cluster or operon. These are collectively known as genomic context methods. On the other hand a method called mirrortree is based on the similarity of phylogenetic trees between two interacting proteins. Comprehensive performance analyses of these methods have been frequently reported in literature. However, very few studies provide insight into the effect of reference genome selection on detection of meaningful protein interactions.
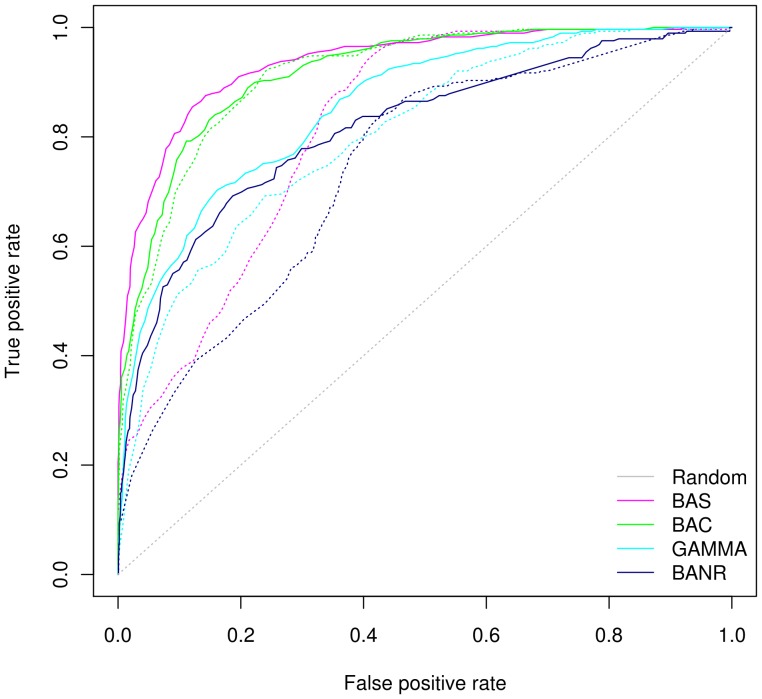
Methods: We analyzed the performance of four methods and their variants to understand the effect of reference genome selection on prediction efficacy. We used six sets of reference genomes, sampled in accordance with phylogenetic diversity and relationship between organisms from 565 bacteria. We used Escherichia coli as a model organism and the gold standard datasets of interacting proteins reported in DIP, EcoCyc and KEGG databases to compare the performance of the prediction methods.
Conclusions: Higher performance for predicting protein-protein interactions was achievable even with 100-150 bacterial genomes out of 565 genomes. Inclusion of archaeal genomes in the reference genome set improves performance. We find that in order to obtain a good performance, it is better to sample few genomes of related genera of prokaryotes from the large number of available genomes. Moreover, such a sampling allows for selecting 50-100 genomes for comparable accuracy of predictions when computational resources are limited.
Conflict of interest statement
Figures


References
-
- Yamada T, Bork P (2009) Evolution of biomolecular networks: lessons from metabolic and protein interactions. Nat Rev Mol Cell Biol 10: 791–803. - PubMed
-
- Zhu X, Gerstein M, Snyder M (2007) Getting connected: analysis and principles of biological networks. Genes Dev 21: 1010–1024. - PubMed
-
- Janga SC, Diaz-Mejia JJ, Moreno-Hagelsieb G (2011) Network-based function prediction and interactomics: the case for metabolic enzymes. Metab Eng 13: 1–10. - PubMed
Publication types
MeSH terms
LinkOut - more resources
Full Text Sources
