Review
. 2012 Jul;12(6):573-84.
doi: 10.1586/erm.12.58.

Detection of miRNAs with a nanopore single-molecule counter

Affiliations
Review

Detection of miRNAs with a nanopore single-molecule counter

Li-Qun Gu et al. Expert Rev Mol Diagn. 2012 Jul.

Abstract

miRNAs are short noncoding RNA molecules that are important in regulating gene expression. Due to the correlation of their expression levels and various diseases, miRNAs are being investigated as potential biomarkers for molecular diagnostics. The fast-growing miRNA exploration demands rapid, accurate, low-cost miRNA detection technologies. This article will focus on two platforms of nanopore single-molecule approach that can quantitatively measure miRNA levels in samples from tissue and cancer patient plasma. Both nanopore methods are sensitive and specific, and do not need labeling, enzymatic reaction or amplification. In the next 5 years, the nanopore-based miRNA techniques will be improved and validated for noninvasive and early diagnosis of diseases.


Figures
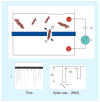
Figure 1
Figure 1. Scheme of nanopore-based single-molecule detection
Voltage is applied using a pair of electrodes that provide an electrochemical circuit with the solution. The voltage (V) drives ions through the nanopore, which results in a measurable steady-state ‘open pore’ current (I). When a biomolecule in the top chamber diffuses into the pore, it blocks the ion pathway of the pore and the flux of ions is reduced, resulting in a negative spike that signals each molecule. Under the same applied voltage conditions, the rate of spike events has a linear correspondence with the macromolecular concentration. Therefore, miRNA duplexes can be counted and quantified by measuring their rate of passage through the pore. A real current trace is shown for illustration, as well as three parameters that are typically quantified in nanopore experiments. δI and td are used to identify the target blocks, while δt is used to calculate the rate of block occurrence, which is the inverted value of δt. δI: Current block amplitude; δt: Interval between adjacent blocks; I: Current; td: Block duration; V: Voltage.
Figure 2
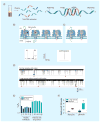
Figure 2. miRNA detection using solid-state molecular counters
(A) Scheme of the miRNA-specific detection method. First, RNA is extracted from tissue (not shown), and the extract is hybridized to a miRNA-specific oligonucleotide probe (red). In step (I), the probe:miRNA duplex is enriched by binding to p19-functionalized magnetic beads, followed by thorough washing in order to remove other RNAs from the mixture. In step (II), the hybridized probe:miRNA duplex is eluted from the magnetic beads. In step (III), the eluted probe:miRNA duplex is electronically detected using a nanopore. (B) Detection of miR-122a from RL RNA using a 3-nm diameter nanopore in a 7-nm thick membrane. Method shown in panel (A) was applied to the detection of miR-122a from 1 μg of RL total RNA. Representative 30-s current versus time traces are shown for a pore after the addition of the enriched miR-122a (RL), a PC containing a synthetic miR-122a RNA duplex bound to magnetic beads, followed by washing, elution and detection (PC), and four different NCs (NC1–NC4). The NCs did not produce any signal below the threshold, which was set to I0–0.4 nA (see dashed gray lines), where I0 was the baseline current. (C) Quantification of miR-122a from the mean capture rates. A calibration curve of capture rate versus concentration was constructed (dashed black line) using different concentrations of synthetic 22-bp RNA duplex, showing that capture rate scales linearly with concentration over three orders of magnitude. Determination of miR-122a amounts (per μl of solution) is based on the spike rate for sample RL (thick red lines) and the positive control PC (thick blue lines). (D) Relative error in the determined RNA concentration as a function of the number of molecules counted by the nanopore (see text). To achieve 95% accuracy under our conditions, the time required for determination of a 1-fmol RNA sample is 4 min, corresponding to approximately 250 translocation events. NC: Negative control; PC: Positive control; RL: Rat liver RNA. Adapted from [35].
Figure 3
Figure 3. miRNA detection using a protein nanopore sensor (see facing page)
(A) Total RNA was extracted from plasma, then mixed with the probe (green) that hybridizes with the target miRNA (red). The probe bears signal tags on each end. (B) Upper panel shows the molecular mechanism of the miRNA:probe hybrid dissociation and translocation in the nanopore. The mixture in (A) was added to the cis solution, and the miRNA:probe hybrid entered the pore from the cis opening. The lower panel is a typical multilevel long block in the nanopore as a signature generated by the hybrid of miR-155 miRNA and its probe P155 (miR-155:P155). It was from a trace recorded at +100 mV in solutions containing 1 M KCl buffered with 10 mM Tris (pH 8.0). Level 1: trapping of the miRNA:probe hybrid in the pore, unzipping of the miRNA from the probe and translocation of the probe through the pore. Level 2: unzipped miRNA residing in the pore cavity. Level 3: translocation of the unzipped miRNA through the pore. (C) A spike-like short block generated by the translocation of unhybridized miR-155 or P155 from the cis solution. (D) Current traces for total plasma RNAs from healthy volunteers (normal sample) and lung cancer patients in the presence of the probe P155. The traces were recorded in 1 M KCl at +100 mV. Red arrows are signature events, which were seen only in the presence of probe for both healthy volunteers and lung cancer patients. (E) Frequency ratio of miR-155 and spiked-in synthetic miR-39 signature events (f155/f39) from six healthy individuals (1–6) and six patients with lung cancer (7–12). Conditions of patients: 7: metastatic squamous lung carcinoma; 8: recurrent small-cell cancer; 9: early-stage small-cell carcinoma, status postchemotherapy and radiation; 10: early-stage small-cell cancer, status postchemotherapy; 11: late-stage non-small-cell carcinoma, status post-resection and -chemotherapy; 12: late-stage adenocarcinoma, status postchemotherapy. (F) Box and whisker plots of the relative miR-155 levels in healthy and lung cancer groups measured with the nanopore sensor and qRT-PCR. Boxes mark the intervals between the 25th and 75th percentiles. Black lines inside the boxes denote the medians. Whiskers denote the intervals between the 5th and 95th percentiles. Filled circles indicate data points outside of the 5th and 95th percentiles. qRT-PCR: Quantitative reverse-transcription PCR. Adapted from [43].

Similar articles

Cited by

References

    1. Carthew RW, Sontheimer EJ. Origins and mechanisms of miRNAs and siRNAs. Cell. 2009;136:642–655. - PMC - PubMed
    1. Kim VN, Han J, Siomi MC. Biogenesis of small RNAs in animals. Nat Rev Mol Cell Biol. 2009;10:126–139. A comprehensive review of small RNAs including miRNAs, siRNAs and piRNAs in terms of biogenesis pathways and their regulations, along with their functions at both the genome and the transcriptome level. - PubMed
    1. Lee RC, Feinbaum RL, Ambros V. The C. elegans heterochronic gene LIN-4 encodes small RNAs with antisense complementarity to lin-14. Cell. 1993;75:843–854. The first publication that identified a small RNA encoded by the LIN-4 locus that was associated to the developmental timing of the nematode Caenorhabditis elegans by binding in the 3′ untranslated region (UTR) of LIN-14 mRNA and negatively modulating the protein Lin-14. - PubMed
    1. Wightman B, Ha I, Ruvkun G. Posttranscriptional regulation of the heterochronic gene LIN-14 by lin-4 mediates temporal pattern formation in C. elegans. Cell. 1993;75:855–862. - PubMed
    1. Kozomara A, Griffiths-Jones S. MiRBase: integrating microRNA annotation and deep-sequencing data. Nucleic Acids Res. 2011;39:D152–D157. - PMC - PubMed

Website

    1. miRBase. http://microrna.sanger.ac.uk.

Publication types

LinkOut - more resources