

Subchronic inhalation exposure study of an airborne polychlorinated biphenyl mixture resembling the Chicago ambient air congener profile
- PMID: 22846166
- PMCID: PMC3573703
- DOI: 10.1021/es301129h
Subchronic inhalation exposure study of an airborne polychlorinated biphenyl mixture resembling the Chicago ambient air congener profile
Abstract
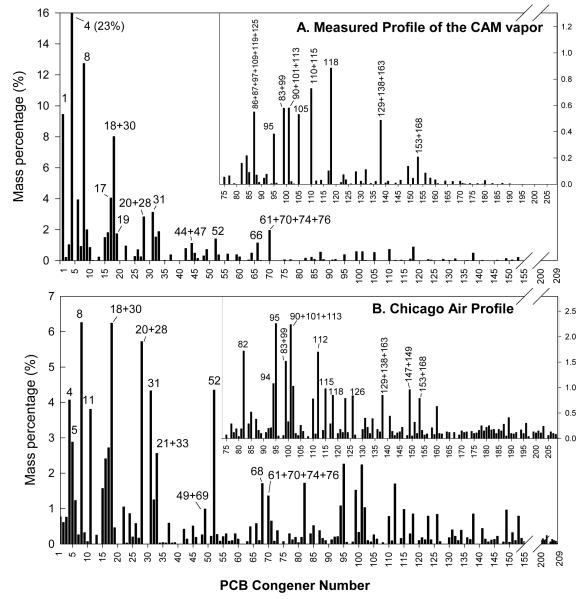
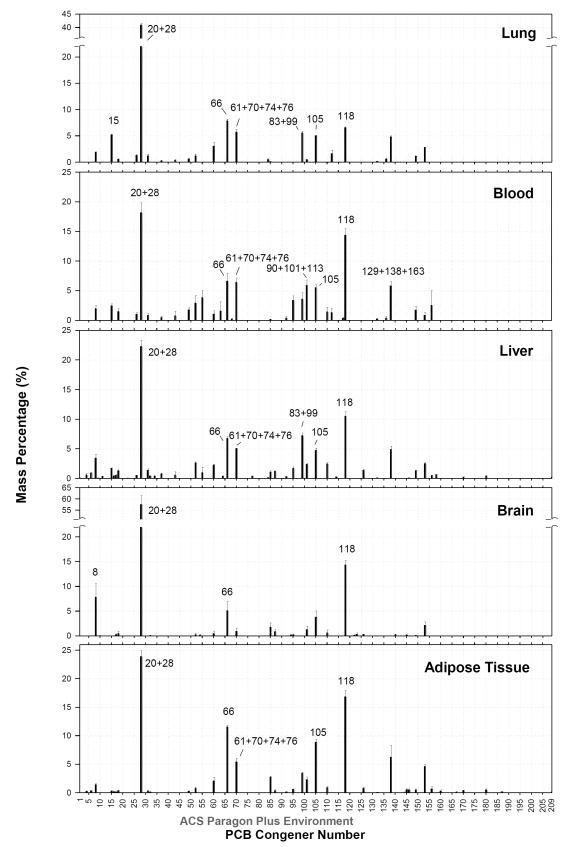
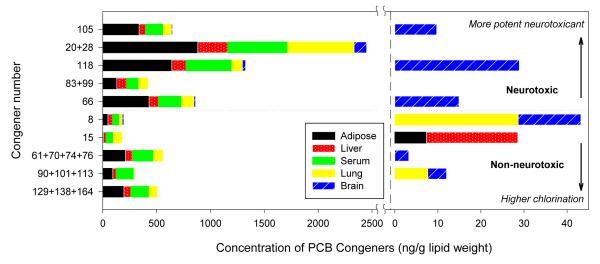
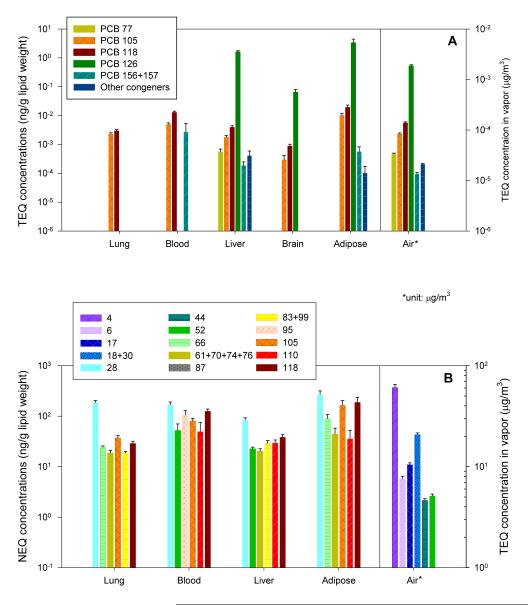
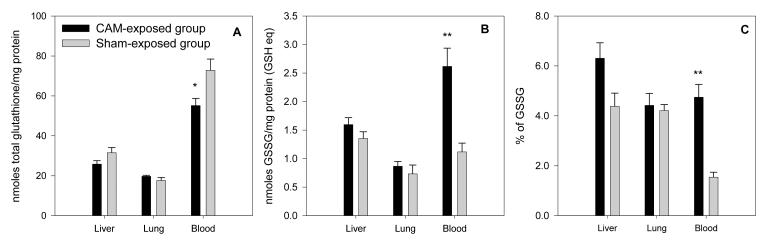
Although inhalation of atmospheric polychlorinated biphenyls (PCBs) is the most universal exposure route and has become a substantial concern in urban areas, research is lacking to determine the body burden of inhaled PCBs and consequent health effects. To reflect the Chicago airshed environment and mimic the PCB profile in Chicago air, we generated vapors from a Chicago air mixture (CAM). Sprague-Dawley rats were exposed to the CAM vapor for 1.6 h/day via nose-only inhalation for 4 weeks, 520 ± 10 μg/m(3). Congener-specific quantification in tissue and air samples was performed by gas chromatography-tandem mass spectrometry (GC/MS/MS). In contrast to the lower-chlorinated congener-enriched vapor, body tissues mainly contained tri- to hexachlorobiphenyls. Congener profiles varied between vapor and tissues and among different organs. The toxic equivalence (TEQ) and neurotoxic equivalence (NEQ) were also investigated for tissue distribution. We evaluated a variety of end points to catalogue the effects of long-term inhalation exposure, including immune responses, enzyme induction, cellular toxicity, and histopathologic abnormalities. Glutathione oxidized/reduced ratio (GSSG/GSH) was increased in the blood of exposed animals, accompanied by elevation of hematocrit. This study demonstrated that inhalation contributed to the body burden of mostly tri- to hexachlorobiphenyls and produced a distinct profile of congeners in tissue, yet minimal toxicity was found at this exposure dose, estimated at 134 μg/rat.
Figures
Similar articles
-
Toxicity Evaluation of Exposure to an Atmospheric Mixture of Polychlorinated Biphenyls by Nose-Only and Whole-Body Inhalation Regimens.Environ Sci Technol. 2015 Oct 6;49(19):11875-83. doi: 10.1021/acs.est.5b02865. Epub 2015 Sep 22. Environ Sci Technol. 2015. PMID: 26348937 Free PMC article.
-
Time course of congener uptake and elimination in rats after short-term inhalation exposure to an airborne polychlorinated biphenyl (PCB) mixture.Environ Sci Technol. 2010 Sep 1;44(17):6893-900. doi: 10.1021/es101274b. Environ Sci Technol. 2010. PMID: 20698547 Free PMC article.
-
Development of a synthetic PCB mixture resembling the average polychlorinated biphenyl profile in Chicago air.Environ Int. 2010 Nov;36(8):819-27. doi: 10.1016/j.envint.2009.03.003. Epub 2009 Apr 17. Environ Int. 2010. PMID: 19375801 Free PMC article.
-
Environmental fate and global distribution of polychlorinated biphenyls.Rev Environ Contam Toxicol. 2009;201:137-58. doi: 10.1007/978-1-4419-0032-6_5. Rev Environ Contam Toxicol. 2009. PMID: 19484591 Review.
-
Effects of polychlorinated biphenyls on the nervous system.Toxicol Ind Health. 2000 Sep;16(7-8):305-33. doi: 10.1177/074823370001600708. Toxicol Ind Health. 2000. PMID: 11693948 Review.
Cited by
-
Chiral polychlorinated biphenyls: absorption, metabolism and excretion--a review.Environ Sci Pollut Res Int. 2016 Feb;23(3):2042-57. doi: 10.1007/s11356-015-4150-2. Epub 2015 Feb 6. Environ Sci Pollut Res Int. 2016. PMID: 25651810 Free PMC article. Review.
-
Elimination of inhaled 3,3'-dichlorobiphenyl and the formation of the 4-hydroxylated metabolite.Environ Sci Technol. 2013 May 7;47(9):4743-51. doi: 10.1021/es3049114. Epub 2013 Apr 25. Environ Sci Technol. 2013. PMID: 23582014 Free PMC article.
-
Assessment of Polychlorinated Biphenyls and Their Hydroxylated Metabolites in Postmortem Human Brain Samples: Age and Brain Region Differences.Environ Sci Technol. 2022 Jul 5;56(13):9515-9526. doi: 10.1021/acs.est.2c00581. Epub 2022 Jun 3. Environ Sci Technol. 2022. PMID: 35658127 Free PMC article.
-
Disposition of phenolic and sulfated metabolites after inhalation exposure to 4-chlorobiphenyl (PCB3) in female rats.Chem Res Toxicol. 2014 Aug 18;27(8):1411-20. doi: 10.1021/tx500150h. Epub 2014 Jul 15. Chem Res Toxicol. 2014. PMID: 24988477 Free PMC article.
-
Effect of pregnancy on the disposition of 2,2',3,5',6-pentachlorobiphenyl (PCB 95) atropisomers and their hydroxylated metabolites in female mice.Chem Res Toxicol. 2015 Sep 21;28(9):1774-83. doi: 10.1021/acs.chemrestox.5b00241. Epub 2015 Aug 13. Chem Res Toxicol. 2015. PMID: 26271003 Free PMC article.
References
-
- Rodenburg LA, Guo J, Du S, Cavallo GJ. Evidence for unique and ubiquitous environmental sources of 3,3′-dichlorobiphenyl (PCB 11) Environ. Sci. Technol. 2010;44:2816–2821. - PubMed
-
- Sun P, Basu I, Blanchard P, Brice KA, Hites RA. Temporal and spatial trends of atmospheric polychlorinated biphenyl concentrations near the great lakes. Environ. Sci. Technol. 2007;41:1131–1136. - PubMed
Publication types
MeSH terms
Substances
Grants and funding
LinkOut - more resources
Full Text Sources
Miscellaneous
