. 2012 Jul 30:13:351.
doi: 10.1186/1471-2164-13-351.

The RosR transcription factor is required for gene expression dynamics in response to extreme oxidative stress in a hypersaline-adapted archaeon

Affiliations

The RosR transcription factor is required for gene expression dynamics in response to extreme oxidative stress in a hypersaline-adapted archaeon

Kriti Sharma et al. BMC Genomics. .

Abstract

Background: Previous work has shown that the hypersaline-adapted archaeon, Halobacterium salinarum NRC-1, is highly resistant to oxidative stress caused by exposure to hydrogen peroxide, UV, and gamma radiation. Dynamic alteration of the gene regulatory network (GRN) has been implicated in such resistance. However, the molecular functions of transcription regulatory proteins involved in this response remain unknown.

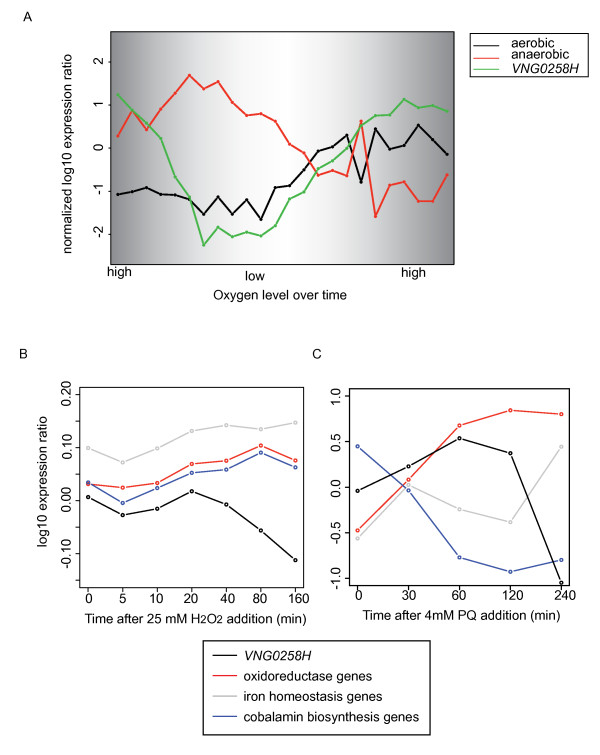
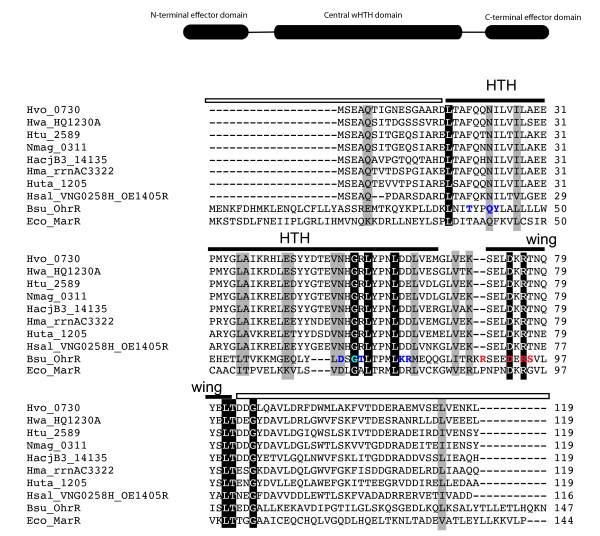
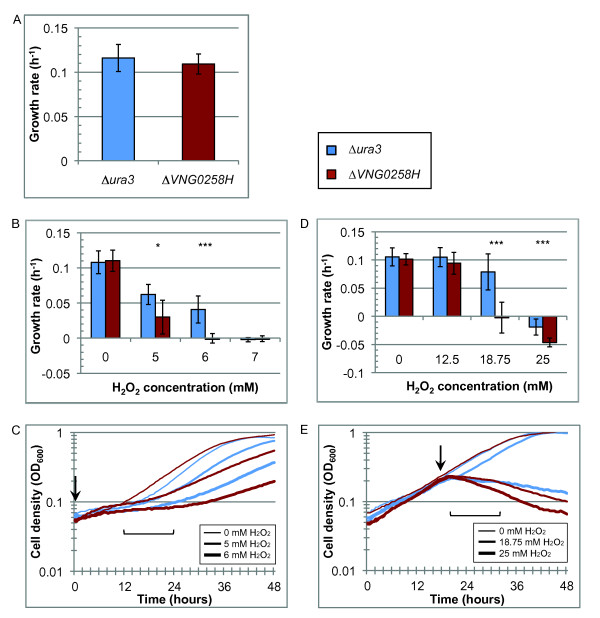
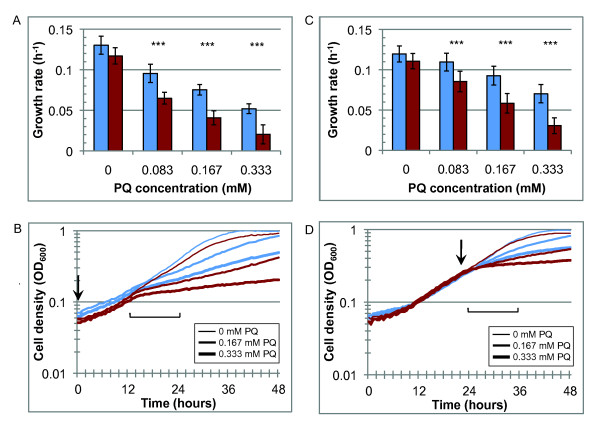
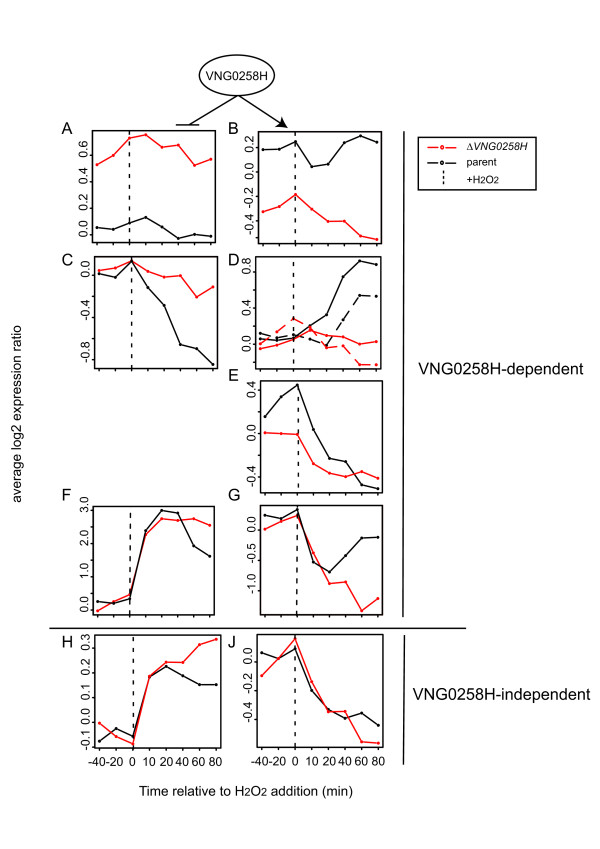
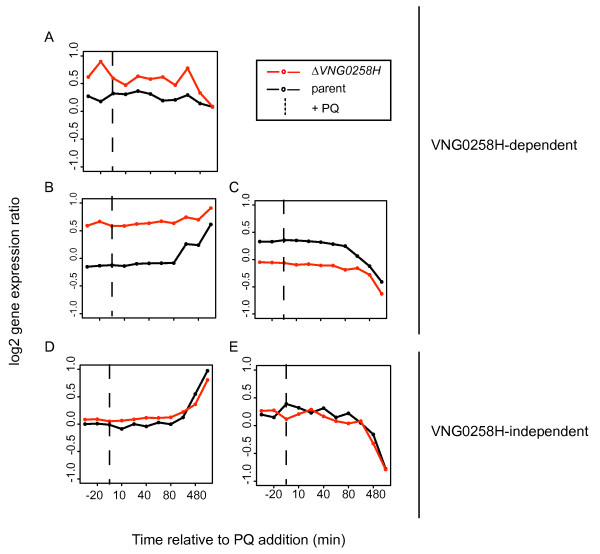
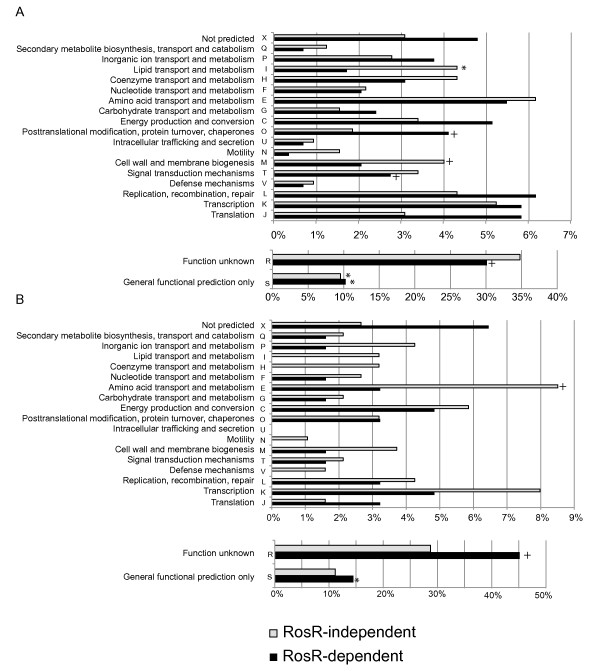
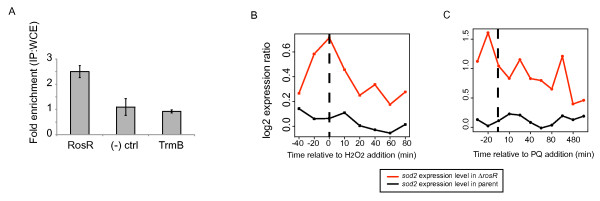
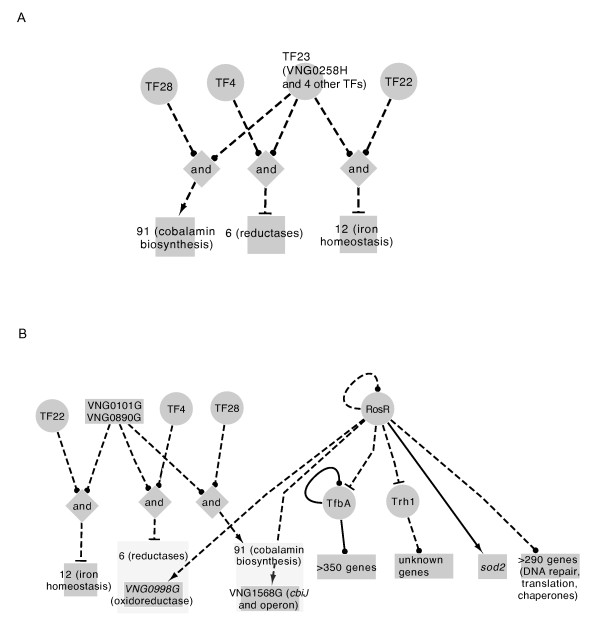
Results: Here we have reanalyzed several existing GRN and systems biology datasets for H. salinarum to identify and characterize a novel winged helix-turn-helix transcription factor, VNG0258H, as a regulator required for reactive oxygen species resistance in this organism. This protein appears to be unique to the haloarchaea at the primary sequence level. High throughput quantitative growth assays in a deletion mutant strain implicate VNG0258H in extreme oxidative stress resistance. According to time course gene expression analyses, this transcription factor is required for the appropriate dynamic response of nearly 300 genes to reactive oxygen species damage from paraquat and hydrogen peroxide. These genes are predicted to function in repair of oxidative damage to proteins and DNA. In vivo DNA binding assays demonstrate that VNG0258H binds DNA to mediate gene regulation.

Conclusions: Together these results suggest that VNG0258H is a novel archaeal transcription factor that regulates gene expression to enable adaptation to the extremely oxidative, hypersaline niche of H. salinarum. We have therefore renamed VNG0258H as RosR, for reactive oxygen species regulator.


Figures

Figure 1
Figure 1
VNG0258Hgene expression in response to H2O2and oxygen. (A) Comparison of VNG0258H gene expression to that of genes involved in aerobic and anaerobic physiology [30]. The x-axis represents shifts in oxygen levels over time in a fermentor. Graph background shading corresponds to the relative oxygen concentration. “High” oxygen represents 100% oxygen saturation in CM medium (5 μM) as measured by a dissolved oxygen probe. “Low” represents 5% saturation or below [30]. The y-axis represents mean and variance normalized log10 expression ratios compared to mid-logarithmic phase H. salinarum. The green trace represents VNG0258H gene expression, whereas black and red traces represent the mean expression profiles for genes encoding proteins involved in aerobic and anaerobic physiology, respectively [30]. (B) Mean gene expression profiles for clusters of genes correlated with VNG0258H mRNA changes in response to H2O2[11]. See legend for colors. (C) Mean gene expression profiles in response to PQ for genes from (A). Colors are as in (B).
Figure 2
Figure 2
Homology of VNG0258H winged helix-turn-helix (wHTH) putative transcription factor with haloarchaeal homologs and bacterial matches to wHTH domain. Residues in bold blue font depict those known to interact with the major groove of OhrR in B. subtilis, whereas those in bold red letters represent residues of the wing that contact the minor groove [52]. In the N- or C-terminal domains (white overbar), no homology was detected outside the halophilic archaea. Perfectly conserved residues are shaded black, whereas conservatively substituted residues are shaded grey. Black overbars designate characterized helix-turn-helix (HTH) and wing regions from bacterial MarR family members. Hvo_0730, Haloferax volcanii (GenBank genome accession NC002945); Hwa, Haloquadratum walsbyi (NC_008212); Htu, Haloterrigena turkmenica (NC_013743); Nmag, Natrialba magadii (NC_013922); Huta, Halorhabdus utahensis (NC_013158); HacjB3, Halalkalicoccus jeotagali.B3 (NC_014297); Hsal, Halobacterium salinarum NRC-1 (NC_002607); Hma, Haloarcula marismortui (NC_006396); Bsu, Bacillus subtilis; Eco, E. coli. Numbers following each species name refer to gene unique identifiers in each genome. OE1405R in H. salinarum is a cross-reference to the corresponding gene in the R1 strain [41].
Figure 3
Figure 3
ΔVNG0258His impaired for growth and survival upon exposure to hydrogen peroxide (H2O2). (A) Comparison of ΔVNG0258H and Δura3 parent growth rates under standard conditions across all experiments (n = 63, see also Additional file 3: Table S1). (B) Mean growth rates for 4 biological replicate cultures treated with H2O2 in lag phase. Blue bars represent Δura3 cultures; red bars represent ΔVNG0258H cultures. Concentration of H2O2 added is indicated on the x-axis. (C) Representative growth curves (1 of 4 biological replicates) for cultures treated with H2O2 at beginning of growth (OD600 ≈ 0.05). Line colors are as in (B). Thin, medium, and thick lines indicate H2O2 added to a final concentration of 0, 5, or 6 mM, respectively (see legend; 7 mM curves omitted for clarity). Downward arrow indicates time of H2O2 addition. Bracket indicates period for which mean growth rates were calculated. (D) Mean growth rates for 7 biological replicate cultures treated with H2O2 in mid-logarithmic growth phase. (E) Representative growth curves for cultures treated with H2O2 in mid-logarithmic phase (OD600 ≈ 0.3). Thin, medium, and thick lines indicate H2O2 added to a final concentration of 0, 18.75, or 25 mM, respectively (curves for 6.25 and 12.5 mM conditions are omitted for clarity). Downward arrow indicates time of treatment. Bracket indicates period for which mean growth rates were calculated. In all bar graphs, error bars represent standard deviation. Asterisks represent statistically significant differences between ΔVNG0258H and parent strain Δura3 under the same growth conditions, where single asterisk indicates a p-value < 0.01, double asterisk indicates p < 0.001, and triple asterisk indicates p < 0.0001. All raw data are given in Additional file 3: Table S1.
Figure 4
Figure 4
ΔVNG0258His impaired for growth and survival upon exposure to paraquat (PQ). (A) Mean growth rates for 7 biological replicate cultures treated in lag phase. Blue bars represent Δura3 cultures; red bars represent ΔVNG0258H cultures. (B) Representative growth curves (1 of 7 biological replicates) for cultures treated with PQ at beginning of growth phase (OD600 ≈ 0.05). Thin, medium, and thick lines indicate PQ added to a final concentration of 0, 0.167, or 0.333 mM, respectively (curve for 0.083 mM omitted for clarity). Downward arrow indicates time of PQ addition. Bracket indicates period for which mean growth rates were calculated. Line colors are as in (A). (C) Mean growth rates for 7 biological replicate cultures treated with PQ in mid-logarithmic growth phase. (D) Representative growth curves (1 of 7 biological replicates) for cultures treated with PQ in mid-logarithmic phase (OD600 ≈ 0.3). Line widths indicate the same PQ concentrations as in (B). Representative curves for 0.083 mM condition are omitted for clarity. Asterisks and error bars are as in Figure 3. All raw data are given in Additional file 3: Table S1.
Figure 5
Figure 5
Gene expression in response to H2O2exposure in the Δura3parent vs ΔVNG0258Hmutant strains. Each line in each graph represents the mean expression profile of gene clusters that rely on VNG0258H for their appropriate expression (A-G) or those that respond to 25 mM H2O2 treatment regardless of strain background (H and J). Time points before and after H2O2 exposure in the Δura3 parent strain (black) or ΔVNG0258H mutant (red) are divided by the dotted line. (A) Genes requiring VNG0258H for repression regardless of condition. (B) Genes requiring VNG0258H for activation regardless of condition. (C) Genes requiring VNG0258H for repression in the presence of H2O2. (D) Genes requiring VNG0258H for activation in the presence of H2O2. Dotted traces represent late waves of gene expression. (E) Genes requiring VNG0258H for repression in the absence of H2O2. (F) Genes requiring VNG0258H for impulse-like dynamic induction. (G) Genes requiring VNG0258H for impulse-like dynamic repression. (H) Genes induced in response to H2O2 but independent of VNG0258H (note the difference in y-axis scale between F and H). (J) Genes repressed in response to H2O2 but independent of VNG0258H. Gene expression profiles for individual genes in each cluster are shown in heat maps in Additional file 8: Figure S3. Detailed annotations for genes in each cluster are listed in Additional file 4: Table S2.
Figure 6
Figure 6
Gene expression in response to PQ exposure in the Δura3parentvs.ΔVNG0258Hmutant strains. Line graphs represent mean expression profiles for each cluster of genes. Colors are as in Figure 5. The dotted line on each graph represents the time of PQ addition to each culture. (A) Genes requiring VNG0258H for repression regardless of PQ addition. (B) Genes requiring VNG0258H for repression in the absence of PQ and up-reguation in the presence of PQ. (C) Genes requiring VNG0258H for activation in the absence of PQ. (D) Genes induced in response to PQ but independent of VNG0258H. (E) Genes repressed in response to PQ but independent of VNG0258H. Gene expression profiles for individual genes in each cluster are shown in Additional file 9: Figure S4. Annotation details for genes in each cluster are listed in Additional file 5: Table S3.
Figure 7
Figure 7
Genes dependent on RosR and responsive to ROS (H2O2and PQ) are enriched for functions in protein and DNA repair. (A) Predicted functions of genes differentially expressed in response to H2O2 according to archaeal Clusters of Orthologous Groups (arCOG) categories [48]. Category annotations are listed in on the Y-axis. Black bars represent the number of genes in each category dependent upon RosR for their differential expression (Figure 5A-G), whereas grey bars enumerate genes in each category that are differentially expressed in response to H2O2 but not affected by the ΔrosR mutation (i.e. “RosR-independent”, Figure 5H and J). (B) Predicted functions of genes differentially expressed in response to paraquat (PQ) according to arCOG. Colors and category annotations are as in (A). Asterisks denote significant overrepresentation of a functional category with p < 0.05. Plus signs (+) indicate enrichment p < 0.2. Details of gene annotations, membership in each arCOG category, and p-values for enrichment for all categories are listed in Additional file 4: Table S2 for H2O2 data and Additional file 5: Table S3 for PQ data.
Figure 8
Figure 8
ChIP-qPCR data suggest that RosR binds DNA directly. Relative enrichment ratio is shown for a 100-bp region in the sod2 promoter region in immunoprecipitates (IP) compared to randomly sheared chromosomal DNA (whole cell extract, WCE). Enrichments are compared for the putative VNG0258H transcription factor, empty plasmid (“mock”) and TrmB (a transcription factor known not to bind to the sod2 locus [20]). Error bars represent +/− SEM from the mean of 4 biological replicate experiments. (B) sod2 (superoxide dismutase) is overexpressed in ΔrosR vs. the parent strain in H2O2 gene expression experiments. Red trace represents microarray gene expression data (also shown in Figure 5A) for sod2 in ΔrosR, whereas the black trace is for the Δura3 parent strain. (C) sod2 (superoxide dismutase) is overexpressed in ΔrosR vs the parent strain in PQ gene expression experiments. Colors are as in (B).
Figure 9
Figure 9
Comparison of GRN topology from previous studies with the RosR regulon characterized here. (A) Subnetwork diagram depicting predictions regarding putative VNG0258H function from the ROS environmental gene regulatory inference network (EGRIN) (adapted from [11]). Circles represent transcription factor (TF) groups. TF group 23 includes VNG0258H and four other putative TFs (VNG0101G, VNG0347G, VNG1496G, and VNG0890G). Diamonds represent combinatorial logic gates (AND). Blunt arrows represent computationally inferred repression influences, whereas pointed arrows are activation influences. Squares represent inferred clusters of co-regulated genes and numbers within the squares refer to EGRIN cluster IDs. (B) Refinements to GRN model based on the work presented in the current study. Node shapes and edge attributes are as in (A). Solid lines indicate direct regulation (i.e. DNA-protein interaction has been detected), whereas dotted lines represent interactions that could be direct or indirect (i.e. direct interaction still needs to be tested). Dark grey boxes within light grey boxes indicate that, out of all genes in the cluster, only the gene indicated in dark grey is RosR-dependent based on the microarray data from the current study.

References

    1. Oren A. Microbial life at high salt concentrations: phylogenetic and metabolic diversity. Saline Systems. 2008;4:2. doi: 10.1186/1746-1448-4-2. - DOI - PMC - PubMed
    1. Whitehead K, Kish A, Pan M, Kaur A, Reiss DJ, King N, Hohmann L, Diruggiero J, Baliga NS. An integrated systems approach for understanding cellular responses to gamma radiation. Mol Syst Biol. 2006;2:47. - PMC - PubMed
    1. Arrage A, Phelps TJ, Benoit RE, White DC. Survival of subsurface microorganisms exposed to UV radiation and hydrogen peroxide. Appl Environ Microbiol. 1993;59:3545–3550. - PMC - PubMed
    1. Busch CR, DiRuggiero J. MutS and MutL are dispensable for maintenance of the genomic mutation rate in the halophilic archaeon Halobacterium salinarum NRC-1. PLoS One. 2010;5(2):e9045. doi: 10.1371/journal.pone.0009045. - DOI - PMC - PubMed
    1. Kish A, DiRuggiero J. Rad50 is not essential for the Mre11-dependent repair of DNA double-strand breaks in Halobacterium sp. strain NRC-1. J Bacteriol. 2008;190(15):5210–5216. doi: 10.1128/JB.00292-08. - DOI - PMC - PubMed

Publication types

MeSH terms