. 2012 Nov 15;63(3):1099-106.
doi: 10.1016/j.neuroimage.2012.07.046. Epub 2012 Jul 28.

Voxel-level functional connectivity using spatial regularization

Affiliations

Voxel-level functional connectivity using spatial regularization

Christopher Baldassano et al. Neuroimage. .

Abstract

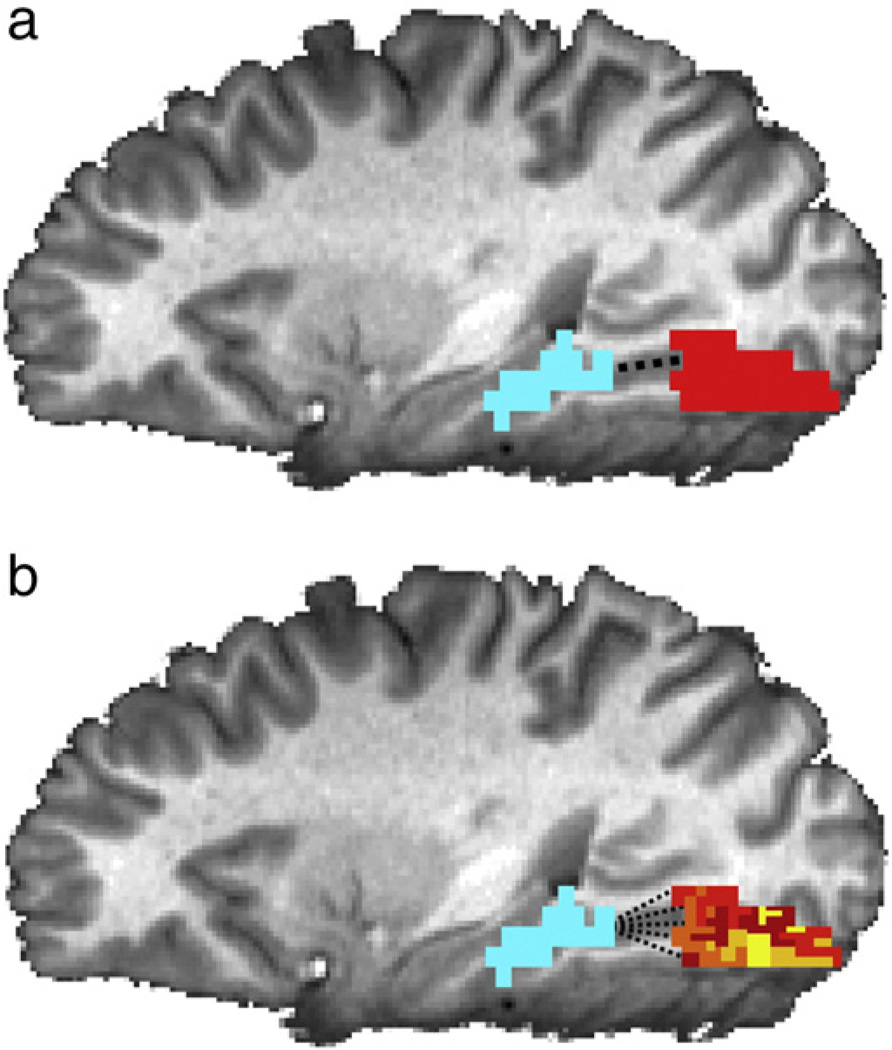
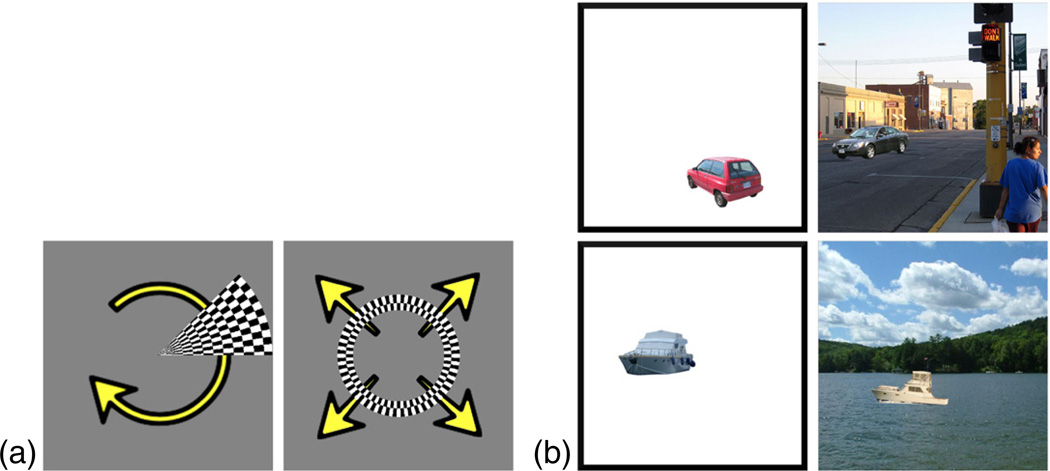
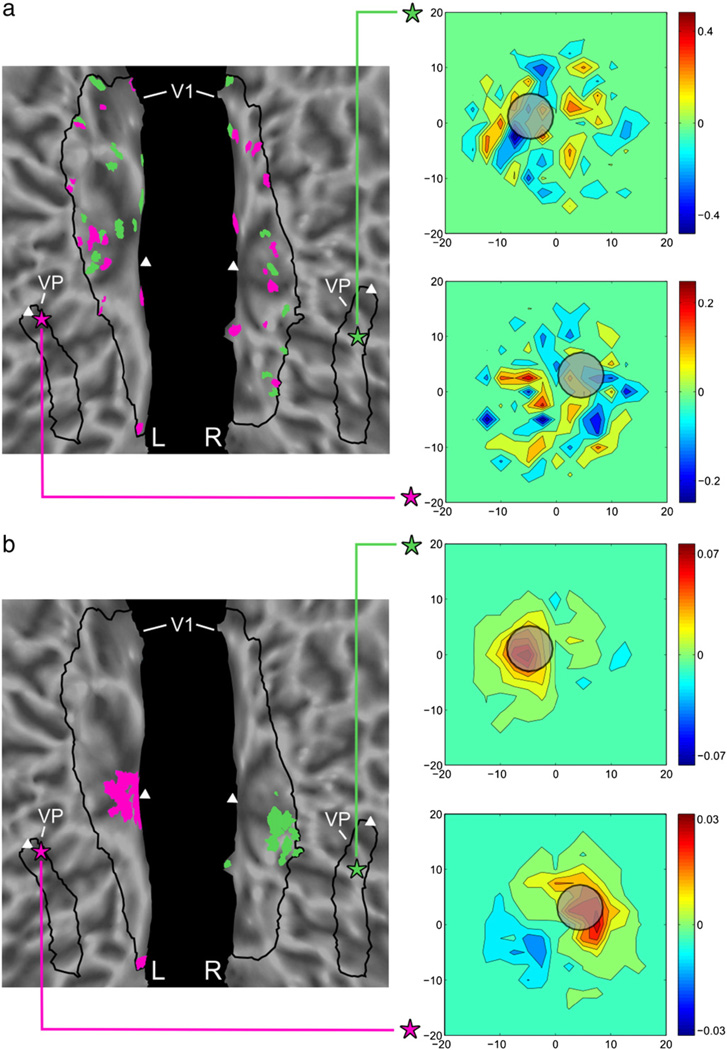
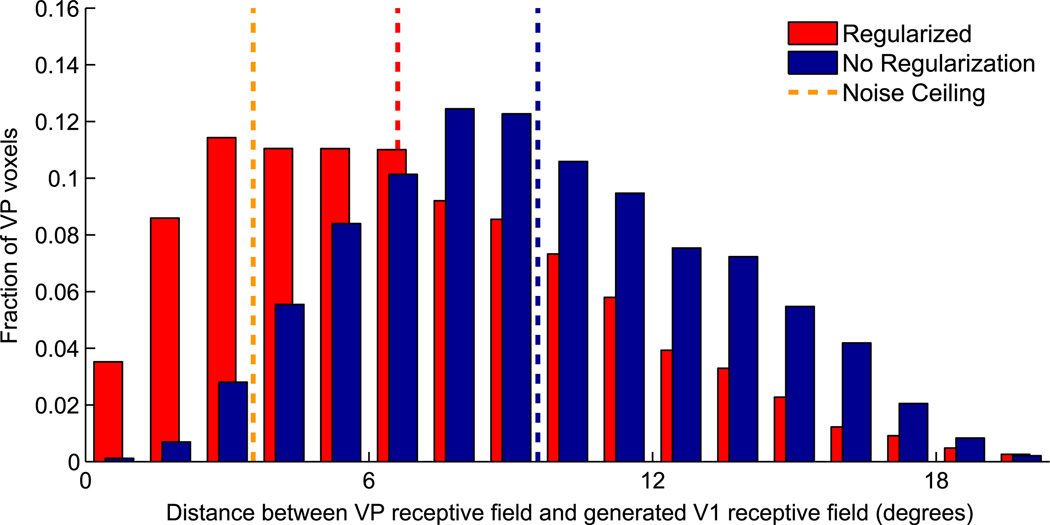
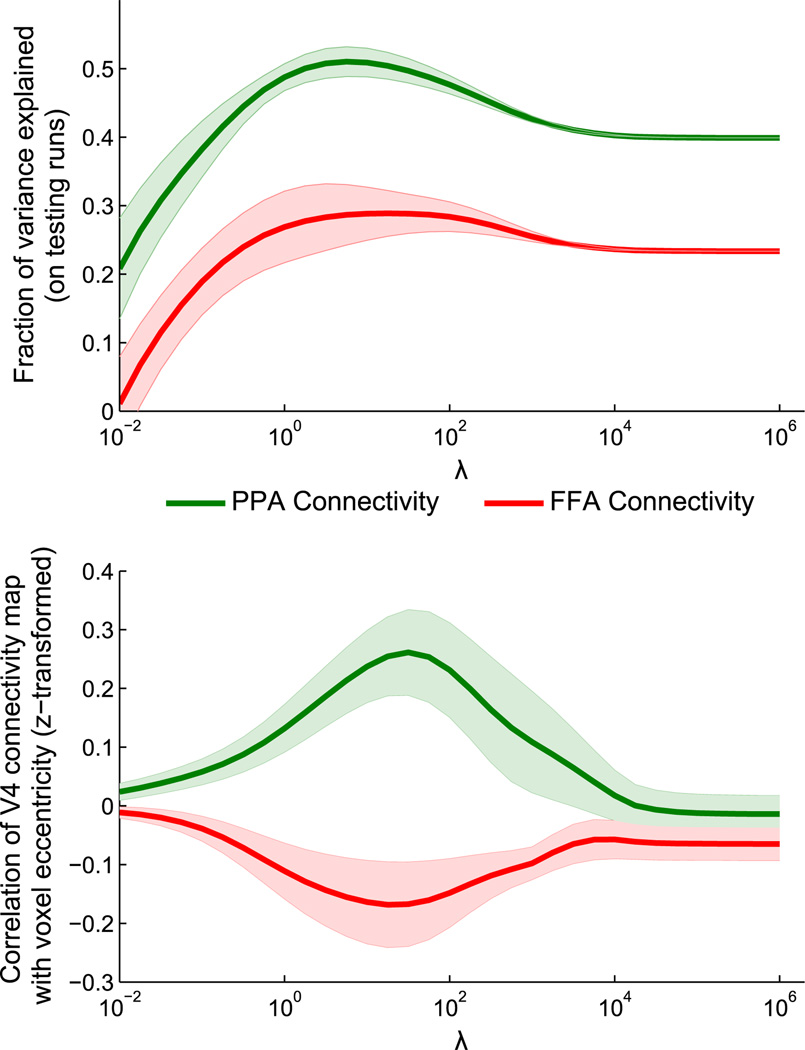
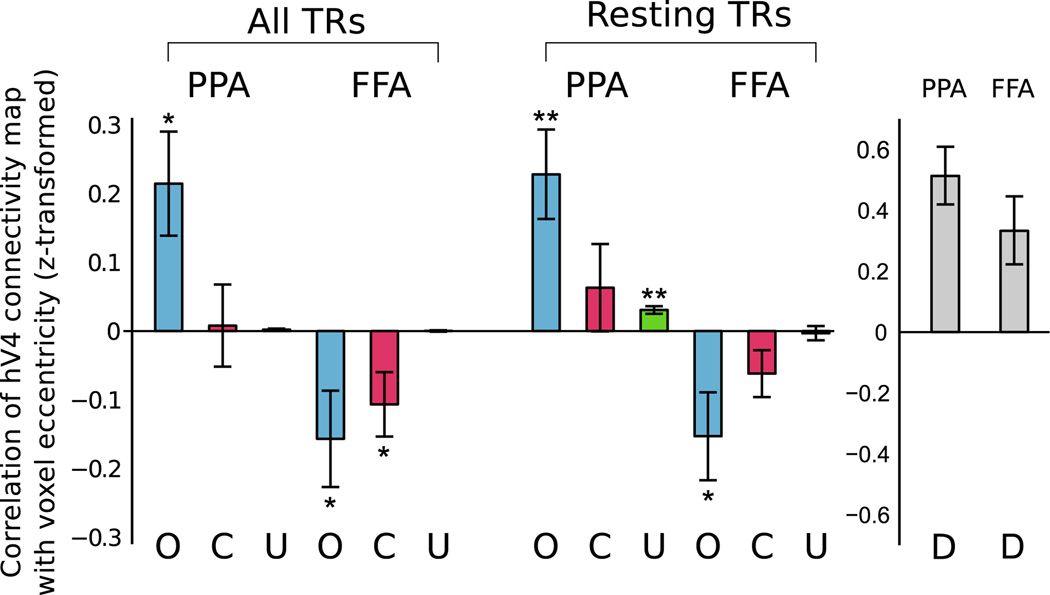
Discovering functional connectivity between and within brain regions is a key concern in neuroscience. Due to the noise inherent in fMRI data, it is challenging to characterize the properties of individual voxels, and current methods are unable to flexibly analyze voxel-level connectivity differences. We propose a new functional connectivity method which incorporates a spatial smoothness constraint using regularized optimization, enabling the discovery of voxel-level interactions between brain regions from the small datasets characteristic of fMRI experiments. We validate our method in two separate experiments, demonstrating that we can learn coherent connectivity maps that are consistent with known results. First, we examine the functional connectivity between early visual areas V1 and VP, confirming that this connectivity structure preserves retinotopic mapping. Then, we show that two category-selective regions in ventral cortex - the Parahippocampal Place Area (PPA) and the Fusiform Face Area (FFA) - exhibit an expected peripheral versus foveal bias in their connectivity with visual area hV4. These results show that our approach is powerful, widely applicable, and capable of uncovering complex connectivity patterns with only a small amount of input data.


Figures

Fig. 1
Fig. 1
Comparison of connectivity maps learned from traditional (a) and regularized (b) methods. (a) In traditional functional connectivity analysis, connectivity with a seed region (blue) is assumed to be identical for all voxels in an ROI (red). (b) Our method can learn a map of weights in an ROI that describes the voxel-level connectivity between each voxel and the seed region. It is possible to learn these maps using a small amount of training data by imposing a spatial smoothness constraint.
Fig. 2
Fig. 2
Stimuli used in our two datasets. (a) The first dataset consists of responses to two flickering checkerboard patterns: a 45° wedge which rotates clockwise through the visual field, and an annulus subtending 3° of visual angle that expands outward from fixation. (b) The second dataset consists of cars and boats, presented either in isolation or in a scene context.
Fig. 3
Fig. 3
Learned connectivity maps and receptive fields for 2 VP voxels, without regularization (a) and with regularization (b). Two VP voxels are denoted by purple and green stars, and the top 30 voxels from the learned connectivity maps are shown in respective color in V1 (triangles indicate the location of the fovea). The inset plots compare the average receptive field of the connected V1 voxels (heatmap) with the actual population receptive field of each VP voxel (gray circle, radius given by the average uncertainty in our receptive field estimates). (a) The unregularized method produces maps with scattered weights, and the receptive fields of the connected V1 voxels are poor predictors of the VP receptive field. (b) The regularized connectivity method learns spatially coherent connectivity maps consistent with retinotopic organization, and the receptive fields of the connected V1 voxels are similar to that of the VP voxel.
Fig. 4
Fig. 4
Histogram comparing the precision of V1 maps generated from VP voxels. The x-axis indicates the difference between the receptive field locations of VP voxels and the weighted average of the receptive fields in corresponding V1 connectivity maps. Since the actual functional connectivity between V1 and VP is known to preserve retinotopy, each VP voxel and its learned V1 connectivity map should have similar receptive field locations. The y-axis shows the fraction of VP voxels in each difference bin spanning 1.2° of visual angle. Red bars (back) show results for regularized maps (λ = 103,k = 10), which demonstrate significantly smaller differences than blue bars (front), which show results for non-regularized maps (λ = 0). The dotted lines compare the median difference of both methods to a loose lower bound, based on the uncertainty in our receptive field estimates.
Fig. 5
Fig. 5
Effects of changing λ on learned hV4 connectivity maps. Connectivity maps over hV4 were learned with different regularization strengths λ, for seed regions PPA and FFA. An appropriate λ value can be chosen by maximizing the generalization performance of the learned maps, based on held-out testing runs (upper plot). At these values of λ, PPA and FFA show connectivity biases toward peripheral and central eccentricities, respectively (lower plot). Shaded regions indicate standard error across subjects (controlling for performance in the fully-regularized condition for the upper plot).
Fig. 6
Fig. 6
hV4 eccentricity differences for optimal values of λ. After choosing an optimal λ value for each subject bfased on generalization performance (see Fig. 5), we compute the eccentricity of hV4 connectivity maps for seed regions PPA and FFA, using our method (O), a voxel correlation method (C), and our method without regularization (U) (results averaged across four runs for each subject). Whether using all timepoints from a run (306 TRs) or using only those timepoints during which no stimulus was presented (approx. 148 TRs), our method finds that connectivity with PPA increases with increasing eccentricity, while the opposite is true for FFA. The correlation and unregularized controls are much less sensitive, showing significantly smaller differences between PPA and FFA eccentricity biases. Additionally, our results cannot be explained simply by local noise correlations; since both PPA and FFA are closer to the anterior (peripheral) side of hV4, such a model would predict similar peripheral eccentricity biases in PPA and FFA (D). Error bars indicate standard error, *p<0.05, **p<0.01.

References

    1. Bouvier S, Epstein RA. Early vs. late components of category selectivity in the parahippocampal place area: a rapid acquisition fmri study. Presented at the Vision Sciences Society 11th Annual Meeting; Naples, FL. 2011.
    1. Chai B, Walther D, Beck D, Fei-Fei L. Exploring functional connectivity of the human brain using multivariate information analysis. Advances in Neural Information Processing Systems. 2009;22
    1. Cohen AL, Fair DA, Dosenbach NU, Miezin FM, Dierker D, Van Essen DC, Schlaggar BL, Petersen SE. Defining functional areas in individual human brains using resting functional connectivity MRI. Neuroimage. 2008;41:45–57. - PMC - PubMed
    1. Conroy B, Singer B, Haxby J, Ramadge P. fMRI-based inter-subject cortical alignment using functional connectivity. Advances in Neural Information Processing Systems. 2009;22 - PMC - PubMed
    1. Cox RW. AFNI: software for analysis and visualization of functional magnetic resonance neuroimages. Comput. Biomed. Res. 1996;29:162–173. - PubMed

Publication types