Features of endogenous cardiomyocyte chromatin revealed by super-resolution STED microscopy
- PMID: 22846883
- PMCID: PMC3704345
- DOI: 10.1016/j.yjmcc.2012.07.009
Features of endogenous cardiomyocyte chromatin revealed by super-resolution STED microscopy
Abstract
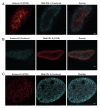
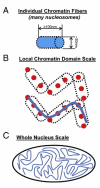
Despite the extensive knowledge of the functional unit of chromatin-the nucleosome-for which structural information exists at the atomic level, little is known about the endogenous structure of eukaryotic genomes. Chromosomal capture techniques and genome-wide chromatin immunoprecipitation and next generation sequencing have provided complementary insight into global features of chromatin structure, but these methods do not directly measure structural features of the genome in situ. This lack of insight is particularly troublesome in terminally differentiated cells which must reorganize their genomes for large scale gene expression changes in the absence of cell division. For example, cardiomyocytes, which are fully committed and reside in interphase, are capable of massive gene expression changes in response to physiological stimuli, but the global changes in chromatin structure that enable such transcriptional changes are unknown. The present study addressed this problem utilizing super-resolution stimulated emission depletion (STED) microscopy to directly measure chromatin features in mammalian cells. We demonstrate that immunolabeling of histone H3 coupled with STED imaging reveals chromatin domains on a scale of 40-70 nm, several folds better than the resolution of conventional confocal microscopy. An analytical workflow is established to detect changes in chromatin structure following acute stimuli and used to investigate rearrangements in cardiomyocyte genomes following agonists that induce cellular hypertrophy. This approach is readily adaptable to investigation of other nuclear features using a similar antibody-based labeling technique and enables direct measurements of chromatin domain changes in response to physiological stimuli.
Copyright © 2012 Elsevier Ltd. All rights reserved.
Figures


Similar articles
-
Super-resolution microscopy approaches to nuclear nanostructure imaging.Methods. 2017 Jul 1;123:11-32. doi: 10.1016/j.ymeth.2017.03.019. Epub 2017 Apr 6. Methods. 2017. PMID: 28390838 Review.
-
3D STED Imaging of Isolated Arabidopsis thaliana Nuclei.Methods Mol Biol. 2025;2873:263-280. doi: 10.1007/978-1-0716-4228-3_15. Methods Mol Biol. 2025. PMID: 39576607
-
Direct visualization of cardiac transcription factories reveals regulatory principles of nuclear architecture during pathological remodeling.J Mol Cell Cardiol. 2019 Mar;128:198-211. doi: 10.1016/j.yjmcc.2019.02.003. Epub 2019 Feb 8. J Mol Cell Cardiol. 2019. PMID: 30742811 Free PMC article.
-
Single cell correlation fractal dimension of chromatin: a framework to interpret 3D single molecule super-resolution.Nucleus. 2014 Jan-Feb;5(1):75-84. doi: 10.4161/nucl.28227. Epub 2014 Feb 19. Nucleus. 2014. PMID: 24637833 Free PMC article.
-
Super-resolution fluorescence microscopy as a tool to study the nanoscale organization of chromosomes.Curr Opin Chem Biol. 2011 Dec;15(6):838-44. doi: 10.1016/j.cbpa.2011.10.004. Epub 2011 Nov 16. Curr Opin Chem Biol. 2011. PMID: 22098720 Review.
Cited by
-
Tricellular junctions regulate intestinal stem cell behaviour to maintain homeostasis.Nat Cell Biol. 2017 Jan;19(1):52-59. doi: 10.1038/ncb3454. Epub 2016 Dec 19. Nat Cell Biol. 2017. PMID: 27992405 Free PMC article.
-
The chromatin-binding protein Smyd1 restricts adult mammalian heart growth.Am J Physiol Heart Circ Physiol. 2016 Nov 1;311(5):H1234-H1247. doi: 10.1152/ajpheart.00235.2016. Epub 2016 Sep 23. Am J Physiol Heart Circ Physiol. 2016. PMID: 27663768 Free PMC article.
-
Exploiting the tunability of stimulated emission depletion microscopy for super-resolution imaging of nuclear structures.Nat Commun. 2018 Aug 24;9(1):3415. doi: 10.1038/s41467-018-05963-2. Nat Commun. 2018. PMID: 30143630 Free PMC article.
-
Epigenomes in Cardiovascular Disease.Circ Res. 2018 May 25;122(11):1586-1607. doi: 10.1161/CIRCRESAHA.118.311597. Circ Res. 2018. PMID: 29798902 Free PMC article. Review.
-
Contribution of advanced fluorescence nano microscopy towards revealing mitotic chromosome structure.Chromosome Res. 2021 Mar;29(1):19-36. doi: 10.1007/s10577-021-09654-5. Epub 2021 Mar 9. Chromosome Res. 2021. PMID: 33686484 Review.
References
-
- Alexander RP, Fang G, Rozowsky J, Snyder M, Gerstein MB. Annotating non-coding regions of the genome. Nat Rev Genet. 2010;11:559–71. - PubMed
Publication types
MeSH terms
Substances
Grants and funding
LinkOut - more resources
Full Text Sources

