. 2012 Sep 21;287(39):32940-52.
doi: 10.1074/jbc.M112.353334. Epub 2012 Jul 30.

Galectin-3 protein regulates mobility of N-cadherin and GM1 ganglioside at cell-cell junctions of mammary carcinoma cells

Affiliations

Galectin-3 protein regulates mobility of N-cadherin and GM1 ganglioside at cell-cell junctions of mammary carcinoma cells

Cécile Boscher et al. J Biol Chem. .

Abstract

Galectin-3 binding to cell surface glycoproteins, including branched N-glycans generated by N-acetylglucosaminyltransferase V (Mgat5) activity, forms a multivalent, heterogeneous, and dynamic lattice. This lattice has been shown to regulate integrin and receptor tyrosine kinase signaling promoting tumor cell migration. N-cadherin is a homotypic cell-cell adhesion receptor commonly overexpressed in tumor cells that contributes to cell motility. Here we show that galectin-3 and N-cadherin interact and colocalize with the lipid raft marker GM1 ganglioside in cell-cell junctions of mammary epithelial cancer cells. Disruption of the lattice by deletion of Mgat5, siRNA depletion of galectin-3, or competitive inhibition with lactose stabilizes cell-cell junctions. It also reduces, in a p120-catenin-dependent manner, the dynamic pool of junctional N-cadherin. Proteomic analysis of detergent-resistant membranes (DRMs) revealed that the galectin lattice opposes entry of many proteins into DRM rafts. N-cadherin and catenins are present in DRMs; however, their DRM distribution is not significantly affected by lattice disruption. Galectin lattice integrity increases the mobile fraction of the raft marker, GM1 ganglioside binding cholera toxin B subunit Ctb, at cell-cell contacts in a p120-catenin-independent manner, but does not affect the mobility of either Ctb-labeled GM1 or GFP-coupled N-cadherin in nonjunctional regions. Our results suggest that the galectin lattice independently enhances lateral molecular diffusion by direct interaction with specific glycoconjugates within the adherens junction. By promoting exchange between raft and non-raft microdomains as well as molecular dynamics within junction-specific raft microdomains, the lattice may enhance turnover of N-cadherin and other glycoconjugates that determine junctional stability and rates of cell migration.


Figures
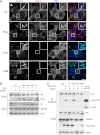
FIGURE 1.
FIGURE 1.
N-cadherin, Gal-3, and Ctb localize to cell-cell junctions. A, Mgat5+/+ cells were untreated (UT) or treated for 48 h with 20 mm sucrose (+Suc), 20 mm lactose (+Lac), or 1 mm swainsonine (+SW) before incubation for 20 min at 4 °C with FITC-coupled Ctb (blue) and cyanine-3-coupled Gal-3 (red). Cells were fixed and stained for N-cadherin (N-cad) (green). Insets show accumulation of Gal-3 and Ctb at N-cadherin-positive cell-cell junctions. Gal-3 binding to the cells is reduced by lactose and swainsonine. Bar: 20 μm. B, Mgat5+/+ cells were untreated or treated for 48 h with 20 mm sucrose, 20 mm lactose, or 1 mm swainsonine and then incubated or not with 1.5 mm EGTA (+E) for 1 h before incubation for 20 min at 4 °C with Gal-3. Cells were then incubated with 0.1 mg/ml DTSSP for 1 h at 4 °C. After quenching and cell lysis, cell extracts were submitted to N-cadherin immunoprecipitation (IP Nc). Pulldowns and total cell extracts (input) were analyzed by Western blot for N-cadherin (Nc) and Gal-3, and inputs were blotted for GAPDH as a loading control. C, Mgat5+/+ cells were treated as described in B except that cells were incubated with GST-Gal-3 and immunoprecipitated with antibodies to β-catenin. 0.5 μg of purified Gal-3-GST were also loaded for Western blot analysis.
FIGURE 2.
FIGURE 2.
Galectin lattice decreases stability of cell-cell junctions. A, Mgat5+/+ cells were transfected with nontargeting RNAi control (siCtl) or with siRNA targeting Gal-3 (siGal-3) 48 h before incubation with 1.5 mm EGTA for 25 min. After fixation, cells were stained for N-cadherin (green) and β-catenin (red). B, Mgat5+/+ cells were untreated (UT) or treated with lactose (+Lac), sucrose (+Suc), or swainsonine (+SW). After 48 h, cells were incubated in low calcium medium (50 μm) for 8 min (left) or treated with 1.5 mm EGTA for 25 min (right) and then fixed. To quantify junction loss, images from all treatment conditions were acquired and thresholded equally, and the extent of colocalization (Pearson's coefficient) of N-cadherin and β-catenin per field was used as a measure of junctional stability. Quantifications of the average colocalization from eight fields containing 10–15 cells are presented ± S.E., *, p < 0.05, **, p < 0.01, ***, p < 0.005. Experiments were reproduced independently three times. Bar: 50 μm. C, Mgat5+/+ cells were transfected with control (siCtl) or Gal-3 targeted (siGal-3) siRNA. After 48 h, cells were incubated with exogenous Gal-3 for 10 min before either the switch to low calcium medium (50 μm) or the addition of 1.5 mm EGTA, as indicated. Junction loss was quantified based on N-cadherin-β-catenin colocalization as described in B.
FIGURE 3.
FIGURE 3.
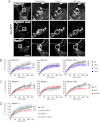
The galectin lattice increases the N-cadherin-GFP mobile fraction at cell-cell junctions. A, Mgat5+/+ or Mgat5−/− cells were transfected with N-cadherin-GFP (Nc-GFP) and treated or not with lactose (+Lac) for 48 h before FRAP analysis (bleached zone is circled). Boxed regions are shown before bleach, immediately after bleach (0 s), and 120 s after bleach. Bar: 20 μm. B, FRAP analysis of N-cadherin-GFP was performed on Mgat5+/+, Mgat5−/−, or Mgat5−/−Res either untreated (UT) or following 48 h of sucrose (+Suc), lactose (+Lac), or swainsonine (+SW) treatment. 12–15 points were acquired from 10–15 cells, and the mean percentages of recovery of N-cadherin-GFP in individual cell-cell junctions are presented as a fitted curve according to the equation Y = Ymax × (1 − exp(−0.69/X × t½)); one of three independent experiments is represented here. A significant decrease in the plateau of the percentage of recovery is observed after lactose or swainsonine treatment in comparison with the sucrose or untreated cells (maximum recovery percentage values (Ymax)) of untreated or sucrose-treated when compared with lactose or swainsonine treatment (p < 0.05). C, FRAP analysis of N-cadherin-GFP in Mgat5+/+, Mgat5−/−, and Mgat5−/−Res cells 48 h after transfection with control siRNA (siCtl) or siRNA against Gal-3 (siGal-3). Untreated cells or siCtl cells displayed a significant higher Ymax values in comparison with the siGal-3-treated cells. D, FRAP analysis of N-cadherin-GFP in Mgat5+/+ cells transfected with control (siCtl) or Gal-3 targeting (siGal-3) siRNA. After 48 h, cells were incubated 10 min with Gal-3 before performing FRAP. Statistical analyzes revealed that the addition of Gal-3 did not affect the Ymax value of siCtl-treated cells but rescued the effect of siGal-3 treatment. Means of percentages of recovery of 12–15 individual cell-cell junctions are presented as fitted curves. Experiments were reproduced independently at least three times. See supplemental Table S1 for analysis of FRAP data from all experiments. Significant p values from Student's t test are indicated. Error bars indicate ± S.E.
FIGURE 4.
FIGURE 4.
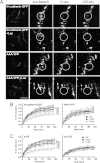
Lattice-dependent N-cadherin-GFP mobility is p120-dependent. A, Mgat5+/+ cells were transfected with N-cadherin-GFP or the AAA-N-cadherin-YFP mutant (AAA-YFP) and grown in the presence of 20 mm sucrose or lactose (+Lac) for 48 h before performing FRAP at cell-cell junctions (circles). Bar: 20 μm. B, recovery curves and statistical analysis of FRAP experiments of sucrose- (+Suc) and lactose (+Lac)-treated N-cadherin-GFP or the AAA-N-cadherin-YFP transfected Mgat5+/+ cells (UT, untreated). C, FRAP analysis of N-cadherin-GFP was performed on Mgat5+/+ cells after transfection with control (siCtl) or p120-catenin targeted (si p120) siRNA and treatment with sucrose or lactose. The means of percentages of recovery of 12–15 individual cell-cell junctions are presented as fitted curves. Experiments were reproduced independently at least three times. See supplemental Table S1 for analysis of FRAP data from all experiments. Significant p values from Student's t test are indicated. Error bars indicate ± S.E.
FIGURE 5.
FIGURE 5.
Galectin lattice limits protein accumulation in rafts but not cadherins and catenins. Triple SILAC was performed on Mgat5+/+ cells growing in media supplemented with normal Lys and Arg (0/0), [2H4]Lys and [13C6]Arg (4/6), or [13C615N2]Lys and [13C615N4]Arg (8/10). 0/0 and 4/6 cells were treated with lactose and sucrose, respectively, with 8/10 as the untreated (UT) control. DRMs were extracted after combining equal amounts of protein from the 0/0, 4/6, and 8/10 lysates. A, the lactose/sucrose ratios for the more than 700 proteins identified are shown here, with specific proteins of interest highlighted. SDPR, serum deprivation factor. B, correlation plot of lactose/sucrose versus lactose/untreated ratios for all quantified proteins in DRMs. Proteins recruited to (blue) and displaced from (red) rafts by lactose treatment are indicated. C, histogram of the number of proteins recruited to (blue) and displaced from (red) rafts upon lactose treatment. D, lactose/sucrose ratios of identified cadherins and catenins fall between the cut-offs (2 and 0.5), indicating that their raft localization is not significantly affected by lactose treatment. Error bars indicate ± S.E.
FIGURE 6.
FIGURE 6.
Galectin lattice increases Ctb dynamics at cell-cell junctions. A, Mgat5+/+ cells were untreated (UT) or treated with 20 mm lactose (+Lac) for 48 h before incubation with Ctb-FITC at room temperature and FRAP of junction-associated regions (circles) at 30 °C. B, Mgat5+/+ cells were untreated, treated with 20 mm sucrose (+Suc) or lactose, treated with 1 mm swainsonine (+SW) alone or in combination with lactose (+Lac+SW), or transfected with control siRNA (siCtl) or siRNA targeting Gal-3 (siGal-3). After 48 h, FRAP experiments were performed on Ctb-FITC located at cell-cell contacts. Cells were preincubated with purified Gal-3 where indicated. Quantification revealed higher Ctb mobility in cell-cell contacts in the presence of an intact galectin lattice. C, FRAP experiments were performed on Ctb-FITC in cellular regions not associated with a contact engaged zone (circles) of untreated cells or cells treated with 20 mm lactose or sucrose. The maximum percentage of recovery (Ymax) values derived from the FRAP showed no statistical difference between the untreated or sucrose-treated cells and the lactose-treated cells. The means of percentages of recovery of 30 individual cell-cell junctions are presented as fitted curves. Experiments were reproduced independently at least three times. See supplemental Table S1 for analysis of FRAP data from all experiments. Significant p values from Student's t test are indicated. Bar: 20 μm. Error bars indicate ± S.E.

Similar articles

Cited by

References

    1. Ahmad N., Gabius H. J., André S., Kaltner H., Sabesan S., Roy R., Liu B., Macaluso F., Brewer C. F. (2004) Galectin-3 precipitates as a pentamer with synthetic multivalent carbohydrates and forms heterogeneous cross-linked complexes. J. Biol. Chem. 279, 10841–10847 - PubMed
    1. Mehul B., Bawumia S., Hughes R. C. (1995) Cross-linking of galectin 3, a galactose-binding protein of mammalian cells, by tissue-type transglutaminase. FEBS Lett. 360, 160–164 - PubMed
    1. Nieminen J., Kuno A., Hirabayashi J., Sato S. (2007) Visualization of galectin-3 oligomerization on the surface of neutrophils and endothelial cells using fluorescence resonance energy transfer. J. Biol. Chem. 282, 1374–1383 - PubMed
    1. Dennis J. W., Nabi I. R., Demetriou M. (2009) Metabolism, cell surface organization, and disease. Cell 139, 1229–1241 - PMC - PubMed
    1. Lau K. S., Partridge E. A., Grigorian A., Silvescu C. I., Reinhold V. N., Demetriou M., Dennis J. W. (2007) Complex N-glycan number and degree of branching cooperate to regulate cell proliferation and differentiation. Cell 129, 123–134 - PubMed

Publication types

MeSH terms