. 2012 Sep 21;287(39):32780-90.
doi: 10.1074/jbc.M112.384354. Epub 2012 Jul 30.

The molecular basis for modulation of human Vγ9Vδ2 T cell responses by CD277/butyrophilin-3 (BTN3A)-specific antibodies

Affiliations

The molecular basis for modulation of human Vγ9Vδ2 T cell responses by CD277/butyrophilin-3 (BTN3A)-specific antibodies

Aparna Palakodeti et al. J Biol Chem. .

Abstract

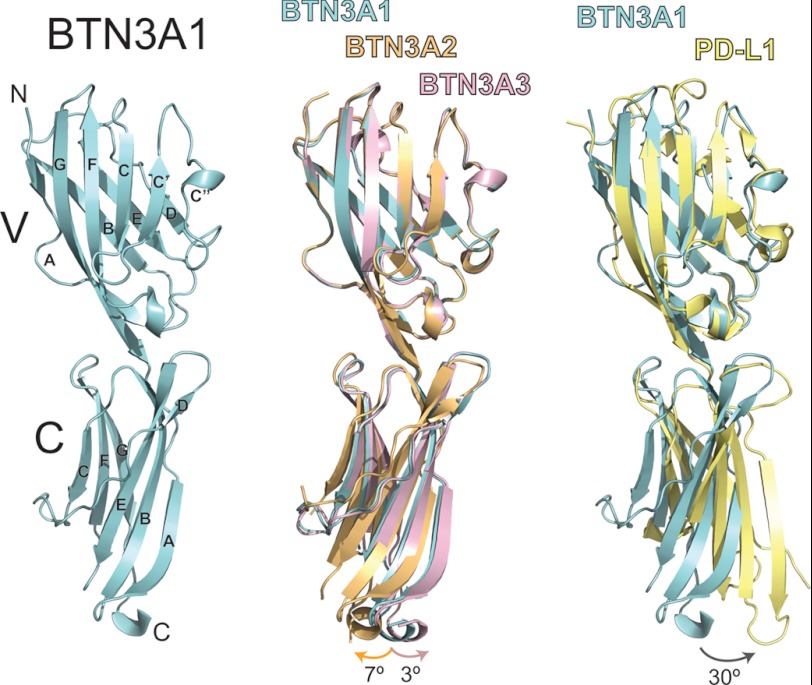
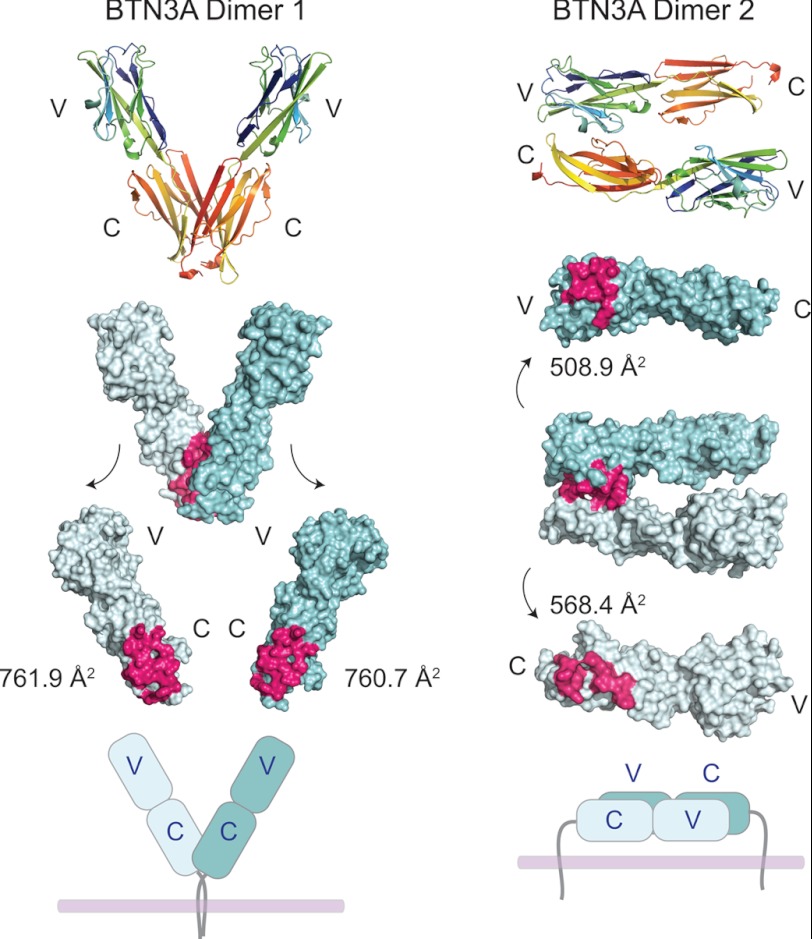
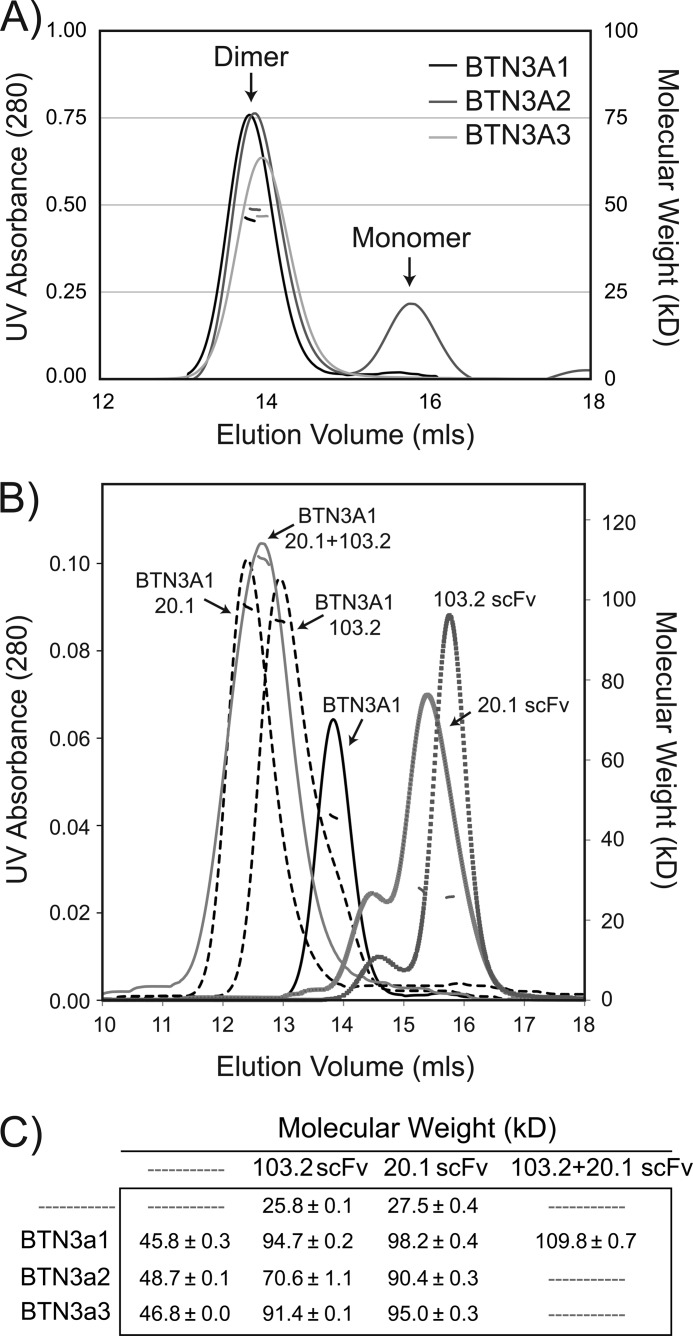
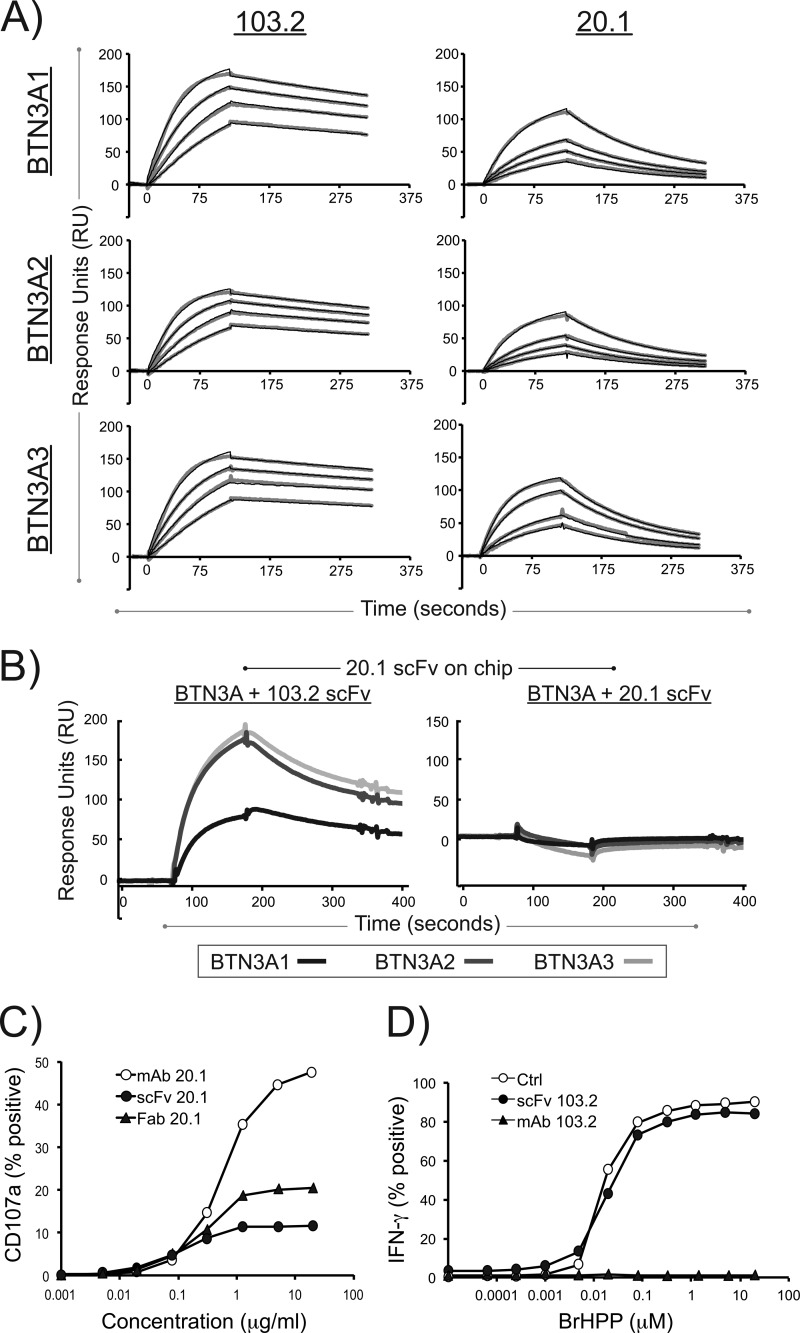
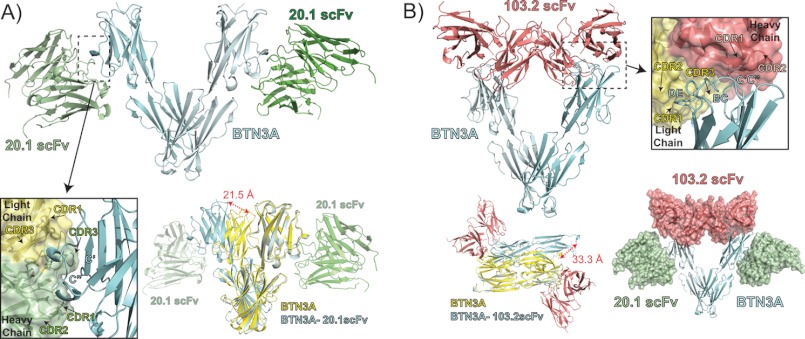
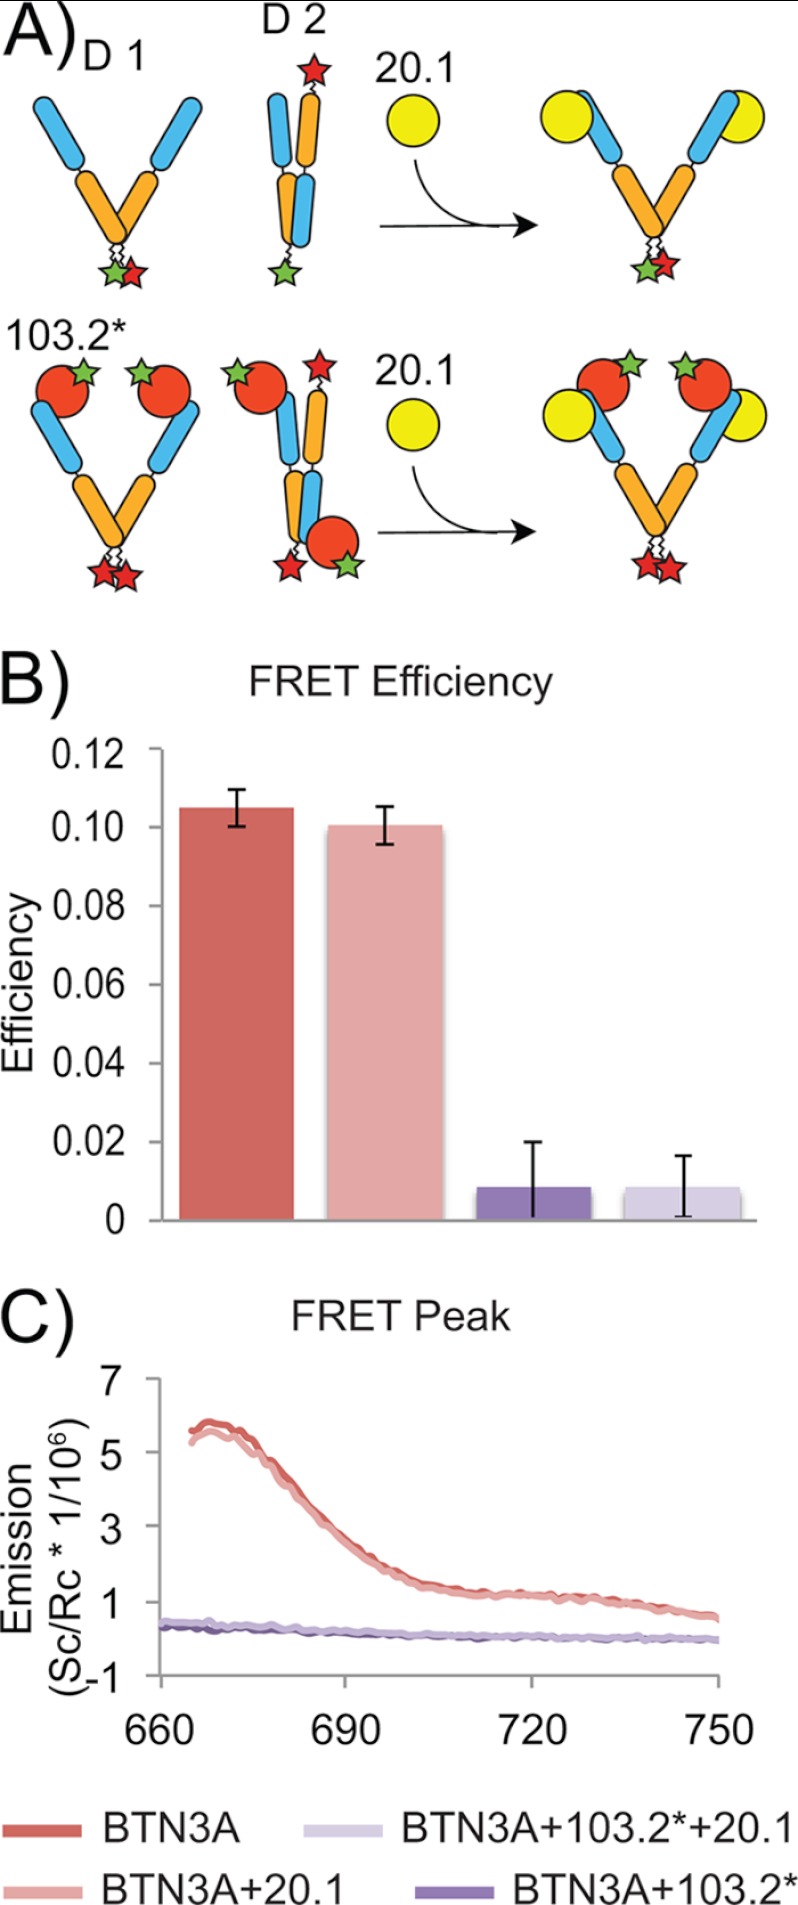
Human Vγ9Vδ2 T cells are well known for their rapid and potent response to infection and tumorigenesis when in the presence of endogenous or exogenous phosphoisoprenoids. However, the molecular mechanisms behind the activation of this γδ T cell population remains unclear. Evidence pointing to a role for the CD277/butyrophilin-3 (BTN3A) molecules in this response led us to investigate the structures of these molecules and their modifications upon binding to an agonist antibody (20.1) that mimics phosphoisoprenoid-mediated Vγ9Vδ2 activation and an antagonist antibody (103.2) that inhibits this reactivity. We find that the three BTN3A isoforms: BTN3A1, BTN3A2, and BTN3A3, have high structural homology to the B7 superfamily of proteins and exist as V-shaped homodimers in solution, associating through the membrane proximal C-type Ig domain. The 20.1 and 103.2 antibodies bind to separate epitopes on the BTN3A Ig-V domain with high affinity but likely with different valencies based on their binding orientation. These structures directly complement functional studies of this system that demonstrate that BTN3A1 is necessary for Vγ9Vδ2 activation and begin to unravel the extracellular events that occur during stimulation through the Vγ9Vδ2 T cell receptor.


Figures

FIGURE 1.
FIGURE 1.
Crystal structures of the BTN3A isoforms. The structure of BTN3A1 is shown colored in cyan in ribbon format (left panel). BTN3A molecules are composed of a membrane-distal Ig-V domain and a membrane-proximal Ig-C domain. The canonical Ig β-strand designations (A–G) are shown for both. The middle panel shows superposition of the BTN3A1 (cyan), BTN3A2 (orange), and BTN3A3 (pink) structures determined in this study. The three structures are superimposed via their highly conserved V domain, demonstrating subtle shifts in the orientation of the C domain. The angle of rotation is shown at the bottom of the structures, with color-coded arrows corresponding to the particular isoform. The right panel shows structural comparison of BTN3A1 with PD-L1, the closest structural homologue to the BTN3A molecules. PD-L1 is shown in yellow. The two molecules were superimposed via their V domains, revealing a C domain shift of ∼30° between the two molecules.
FIGURE 2.
FIGURE 2.
Dimerization of the BTN3A molecules in the crystal lattice. Two potentially physiologically relevant dimerization states were noted in the crystal lattices of each BTN3A isoform. BTN3A1 is shown as the representative. Top panel, BTN3A1 is in rainbow colors from the N terminus to the C terminus to clarify domain orientation of the two dimerization states. The Dimer 1 contact surface is symmetric via the A and G β-strands of the C domains of BTN3A, whereas the Dimer 2 contact surface is asymmetric, via a head-to-tail orientation via the C, C′, and C″ β-strands of the V domain with the A and D β-strands of the C domain. Middle panel, both dimers are shown as surface representations, with the dimerization interface color-coded in hot pink. The BSA in Å2 is indicated next to both dimer forms. Bottom panel, a cartoon representation of how these dimers would exist on the cell surface based on the location of the C-terminal transmembrane domains.
FIGURE 3.
FIGURE 3.
MALS establishes that BTN3A molecules exist as dimers in solution. A, MALS data of each BTN3A isoform reveals a clear dimer peak in solution with an estimated molecular masses of ∼46, ∼49, and ∼47 kDa for isoforms A1, A2, and A3, consistent with a BTN3A dimer. The left axis is UV absorbance from S200 size exclusion chromatography, and the right axis is the calculated molecular mass (kDa) from the light scattering. B, MALS data of BTN3A1 alone (solid black line) and in complex with the 20.1 scFv (∼98 kDa), the 103.2 scFv (∼95 kDa) (dashed lines), and both 20.1 and 103.2 (∼110 kDa) (solid gray line). Shown also are the profiles for the 20.1 and 103.2 scFvs alone, indicating estimated molecular masses of ∼26 and ∼28 kDa, respectively. C, molecular masses of BTN3A isoforms, individually and in complex, calculated from the MALS data.
FIGURE 4.
FIGURE 4.
Surface plasmon resonance of the 20. 1 and 103.2 antibodies with BTN3A1, BTN3A2, and BTN3A3 reveal high affinities and noncompetitive binding. A, representative sensograms are shown for the surface plasmon resonance analysis of 20.1 scFv and 103.2 scFv binding to the three BTN3A isoforms. Each BTN3A isoform was immobilized on an individual flow cell on a sensor chip, and the scFv were flowed as analyte at concentrations ranging from 10 to 80 nm. The data curves are shown in gray, and the modeled fit is shown as black lines. B, competition assay between the 20.1 and 103.2 scFv for BTN3A isoforms. The 20.1 scFv was immobilized on the sensor chip surface and complexes of either BTN3A-103.2scFv (left panel) or BTN3A-20.1 scFv (right panel) were flowed as analyte. Clear binding is observed with the BTN3A-103.2 scFv complex, whereas binding is blocked with the BTN3A-20.1 scFv, indicating that the two scFvs bind different epitopes on the BTN3A molecules. C, CD107a expression on the human Vγ9Vδ2 T cell line GUI following incubation with either 20.1 full-length antibody (open circles), 20.1 Fab fragments (filled triangles), or 20.1 scFv (filled circles) used at the indicated concentrations. The data are presented as the percentages of CD107a+ γδ T cells and are representative of more than three experiments. D, IFN-γ expression in human Vγ9Vδ2 T cell line GUI following activation by increasing doses of bromohydrin pyrophosphate/phosphostim (BrHPP) in the presence of the 103.2 full-length antibody (filled triangles), 103.2 scFv (filled circles), or no antibody (open circles). The data are presented as the percentages of IFN-γ+ γδ T cells and are representative of more than three experiments.
FIGURE 5.
FIGURE 5.
Complex structures of BTN3A1 with the 20.1 scFv and 103.2 scFv. A, ribbon diagram showing the complex between the BTN3A1 isoform (cyan) and the 20.1 scFv (green). The 20.1 scFv binds BTN3A1 on the side of the V domain, contacting the C′ and C″ β-strands (see inset), with the binding interface dominated by heavy chain CDR1, CDR2, and CDR3 loop contacts (shown in green; light chain is shown in yellow for contrast). The BTN3A1 dimer present in the complex structure (shown in cyan with 20.1scFv in green) is similar in its general orientation to that of Dimer 1 in the uncomplexed BTN3A (shown in yellow); however, it is shifted at the dimerization interface, resulting in an ∼20 Å displacement as measured between V domains, as indicated by the red arrow. B, complex between the 103.2 scFv and BTN3A1, shown as ribbons in red and cyan, respectively. The 103.2 scFv binds at the top of the V domain, contacting the DE, BC, and C′C″ loops (see inset). The dimerization interface of the BTN3A molecules is similar to that of the unliganded BTN3A molecules, where Dimer 1 is strictly conserved and Dimer 2 is shifted and rotated ∼33 Å as measured from the C termini of the two dimer forms (lower left panel). The 20.1 (green) and 103.2 (red) scFvs bind to separate epitopes on BTN3A as shown from their superposition on the BTN3A1 Dimer 1 (lower right panel).
FIGURE 6.
FIGURE 6.
FRET investigation of BTN3A1 dimers. A, cartoon schematic presenting FRET strategy and experimental set-up. Upper panel, BTN3A1 was labeled with both donor (Atto532) and acceptor (Cy5) dyes. FRET efficiency was determined before and after the addition of the 20.1 scFv allowing for direct investigation of Dimer 1 in solution. Lower panel, BTN3A1 was labeled with donor and 103.2 scFv with acceptor (designated as 103.2*) to investigate the presence of the Dimer 2 in solution. FRET efficiency was determined as above. B, background subtracted fluorescence measurements after excitation of the donor. Dually labeled BTN3A1 measurements are shown in red, BTN3A1-103.2 inter-protein measurements are show in purple. Measurements after the addition of 20.1 are shown in light red and light purple, colored respective to the initial condition. C, calculated FRET efficiency for each scheme as determined from 665 to 750 nm for each.

References

    1. Bonneville M., O'Brien R. L., Born W. K. (2010) γδ T cell effector functions. A blend of innate programming and acquired plasticity. Nat. Rev. Immunol. 10, 467–478 - PubMed
    1. Hayday A. C. (2009) γδ T cells and the lymphoid stress-surveillance response. Immunity 31, 184–196 - PubMed
    1. Bonneville M., Scotet E. (2006) Human Vγ9Vδ2 T cells. Promising new leads for immunotherapy of infections and tumors. Curr. Opin. Immunol 18, 539–546 - PubMed
    1. Morita C. T., Jin C., Sarikonda G., Wang H. (2007) Nonpeptide antigens, presentation mechanisms, and immunological memory of human Vγ2Vδ2 T cells. Discriminating friend from foe through the recognition of prenyl pyrophosphate antigens. Immunol. Rev. 215, 59–76 - PubMed
    1. Kabelitz D. (2010) Human γδ T lymphocytes for immunotherapeutic strategies against cancer. F1000 Med. Rep. 2, 45. - PMC - PubMed

Publication types

MeSH terms

LinkOut - more resources