. 2012 Oct;17(10):1066-78.
doi: 10.1007/s10495-012-0745-y.

A possible cross-talk between autophagy and apoptosis in generating an immune response in melanoma

Affiliations

A possible cross-talk between autophagy and apoptosis in generating an immune response in melanoma

Azim Hossain et al. Apoptosis. 2012 Oct.

Abstract

Melanoma is the most aggressive form of skin cancer, responsible for the majority of skin cancer related deaths. Thus, the search for natural molecules which can effectively destroy tumors while promoting immune activation is essential for designing novel therapies against metastatic melanoma. Here, we report for the first time that a natural triterpenoid, Ganoderic acid DM (GA-DM), induces an orchestrated autophagic and apoptotic cell death, as well as enhanced immunological responses via increased HLA class II presentation in melanoma cells. Annexin V staining and flow cytometry showed that GA-DM treatment induced apoptosis of melanoma cells, which was supported by a detection of increased Bax proteins, co-localization and elevation of Apaf-1 and cytochrome c, and a subsequent cleavage of caspases 9 and 3. Furthermore, GA-DM treatment initiated a possible cross-talk between autophagy and apoptosis as evidenced by increased levels of Beclin-1 and LC3 proteins, and their timely interplay with apoptotic and/or anti-apoptotic molecules in melanoma cells. Despite GA-DM's moderate cytotoxicity, viable cells expressed high levels of HLA class II proteins with improved antigen presentation and CD4+ T cell recognition. The antitumor efficacy of GA-DM was also investigated in vivo in murine B16 melanoma model, where GA-DM treatment slowed tumor formation with a significant reduction in tumor volume. Taken together, these findings demonstrate the potential of GA-DM as a natural chemo-immunotherapeutic capable of inducing a possible cross-talk between autophagy and apoptosis, as well as improved immune recognition for sustained melanoma tumor clearance.


Conflict of interest statement

Conflict of Interest: No conflicts of interest were disclosed by the authors.

Figures

Figure 1
Figure 1
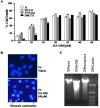
Anti-proliferative and apoptotic activity of GA-DM on human melanoma cells. (A) Cells were treated with vehicle (DMSO) alone or GA-DM (10-80μM) for 24h at 37°C, followed by the MTS viability assay as described in the Materials and Methods. Control cells treated with vehicle alone were utilized to calculate the percent cell death induced by GA-DM as indicated. The data shown are results of at least three separate experiments that were performed in triplicate wells. Error bars represent mean ± S.D. (B) Hoechst staining of J3 melanoma cells treated with vehicle alone or 40 μM of GA-DM. Cells treated with GA-DM showed typical morphology of the apoptotic nuclei stained with Hoechst, in which chromatin was condensed and aggregated at the nuclear membrane as indicated by bright fluorescence at the periphery (arrows). (C) Agarose gel electrophoresis of DNA extract showing internucleosomal DNA fragmentation after treatment of J3 cells with GA-DM (40μM) for 24 h. Cells treated with staurosporine (1 μM) was used as positive control.
Figure 2
Figure 2
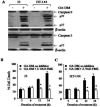
GA-DM induces caspase-dependent apoptosis in melanoma cells. (A) Western blot analysis shows protein expression and cleavage of caspases 9 and 3 in melanoma cells treated with vehicle alone (control) versus 40μM of GA-DM for 24 h. β-actin was utilized as a loading control. (B, C) Inhibition of caspases by a pan caspase inhibitor, Z-VAD-FMK, decreased GA-DM-induced cell death in J3 and HT-144 melanoma cells. Cells were treated with vehicle alone or GA-DM (40μM) for 3, 6, 12, and 24 h in the presence or absence of Z-VAD-FMK at 37°C, followed by the MTS viability assay as described. Experiments were repeated at least three times, and data were expressed as mean ± S.D. Significant differences were calculated by student's t test; *p <0.001.
Figure 3
Figure 3
GA-DM treatment alters apoptosis regulatory proteins in melanoma cells. (A) Western blot analysis of whole cell lysates shows the expression of Bcl-2, Bax, and survivin proteins. Cells were treated with vehicle alone or 40 μM of GA-DM for 24 h at 37°C, followed by western blotting as described. β-actin was used as a loading control. (B) Densitometric analysis of protein bands detected in Fig. 3A. Although there was no detectable change in Bcl-2 proteins, upregulation of pro-apoptotic Bax was consistent with a sharp decline in anti-apoptotic survivin. Data represent average ± S.D. Significant differences from controls were calculated by student's t test; *p<0.05, **p<0.01. (C) Western blot analysis shows upregulation of cytochrome c and Apaf-1 in cytoplasmic fractions of melanoma cells. β-actin was used as a loading control. The figures shown are representative of three independent experiments. (D) J3 cells were treated with vehicle alone or GA-DM (40 μM) for overnight, followed by staining with TMRE as described. Cells were then analyzed by flow cytometry for depolarized mitochondria. Data are representative of at least three separate experiments.
Figure 4
Figure 4
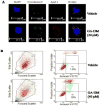
GA-DM treatment upregulates cytochrome c and Apaf-1 proteins in melanoma cells. (A) Cells treated with vehicle alone or GA-DM (40 μM) were simultaneously stained with primary antibodies against cytochrome c and Apaf-1, followed by fluorophore-conjugated secondary antibodies as described in the Materials and Methods. Representative confocal microscopy images of J3 melanoma cells indicate increased levels of cytochrome c (green) and Apaf-1 proteins (red) and their co-localization (overlay, yellow) following GA-DM treatment. DAPI (blue) was used to stain nuclei of J3 cells. (B) Dot plot depicting forward-(FSC) versus side-scatter (SSC) profile of J3 cells (at least 20,000 events/sample) after incubation with GA-DM (40 μM) or vehicle for 24 h at 37°C. The bulk of J3 cells (in the gate R1) distinguishable from smaller cellular debris (low FSC) and larger cell clumps (high FSC), were analyzed for annexin V and PI double staining (right panels). The quadrants (R2) represent the annexin V-positive apoptotic cells. Data are representatives of at least three independent experiments with similar patterns.
Figure 5
Figure 5
GA-DM treatment induces cross-talk between autophagy and apoptosis in melanoma cells, and concurrent activation of HLA class II and Lamp-2 proteins. (A) J3 melanoma cells were treated with GA-DM (40 μM) for 3-24 h. Western blot analysis shows that GA-DM treatment induced an earlier time-dependent upregulation of autophagic proteins Beclin-1 and LC3 (3-6 h), and a later time-dependent activation and processing of effector caspase 3 (12-24 h) in J3 cells. Treatment of melanoma cells with GA-DM (40 μM) also induced a time-dependent increase in HLA class II and Lamp-2 proteins. (B, D) Protein bands detected in Fig. 5(A) were analyzed by densitometric analysis, which showed time-dependent expression of Beclin-1, LC3, HLA class II, and Lamp-2 molecules in GA-DM-treated cells, β-actin was used as a reference band to normalize the original protein loading and to quantitate the expression of these proteins. (C) Data showing that GA-DM induces autophagy (cell survival) at earlier time points (3-6 h), and apoptosis (cell death) at later time points (12-24h) in GA-DM treated cells. Blocking autophagy with 3-MA treatment (5 mM) induced melanoma cell death at early time points (3-6 h). Apoptotic death of melanoma cells might have occurred by overwhelmed autophagy in the first 6 h of GA-DM treatment. Data represent mean ± S.D of triplicate wells. Significant differences were calculated by student's t test; *p<0.01.
Figure 6
Figure 6
GA-DM treatment alters the components of the HLA class II pathway, and increases antigen presentation and CD4+ T cell recognition of melanoma cells. (A) Western blot analysis shows an increased expression of HLA-DR and HLA-DM molecules, and a slight change in Ii protein expression in J3.DR4 and HT-144 cells treated with GA-DM (20μM) at 37°C for 24 h. (B) Densitometric analysis of protein bands detected in Western blotting in Fig. 6(A). β-actin was used as a reference to quantitate the relative expression of proteins in both control and GA-DM treated cells. Significant differences to controls were calculated by student's t test; *p<0.01, ns = not significant. (C) Antigen presentation assay shows an improved antigen presentation and CD4+ T cell recognition of three different melanoma cells treated with GA-DM. J3 cells were transduced with HLA-DR4 molecules as described. HT-144 and 1359-mel cells innately express cell surface HLA-DR4 proteins. These cells were treated with vehicle alone or 20μM of GA-DM for 24 h in 96-well plates, followed by the addition of HSA64-76K peptide for another 4 h. Cells were then washed, and co-cultured with the peptide specific CD4+ T cell hybridoma for 24 h. The production of IL-2 was measured by ELISA and expressed as pg/ml ± SD of triplicate wells of at least three independent experiments. *p<0.01
Figure 7
Figure 7
GA-DM treatment reduces melanoma growth in vivo in murine B16 melanoma model. Mice were injected with two doses (50mg/kg) of GA-DM intraperitoneally (i.p.) on days 7 and 10 after subcutaneous (s.c.) injection of B16 melanoma cells as described. (A) Photographs showing a slower tumor growth in GA-DM-treated mouse as compared to the control group. (B) Analysis of tumor growth shows a significant decline in tumor volume in GA-DM-treated mice (n=6). Data represent average tumor volume ± S.D. (C) Immunohistochemistry of tumor tissue with anti-CD3 showing T cell infiltration at day 14, 17 and 19 after B16 tumor implantation. Significant differences were calculated by ANOVA tests as described in the methods. *p<0.05, **p<0.01.

Similar articles

Cited by

References

    1. Rigel DS, Russak J, Friedman R. The evolution of melanoma diagnosis: 25 years beyond the ABCDs. CA Cancer J Clin. 2010;60:301–316. - PubMed
    1. Reed KB, Brewer JD, Lohse CM, Bringe KE, Pruitt CN, Gibson LE. Increasing incidence of melanoma among young adults: an epidemiological study in Olmsted County, Minnesota. Mayo Clin Proc. 2012;87:328–334. - PMC - PubMed
    1. Blank CU, Hooijkaas AI, Haanen JB, Schumacher TN. Combination of targeted therapy and immunotherapy in melanoma. Cancer Immunol Immunother. 2011;60:1359–1371. - PMC - PubMed
    1. Boyle GM. Therapy for metastatic melanoma: an overview and update. Expert Rev Anticancer Ther. 2011;11:725–737. - PubMed
    1. Balch CM, Gershenwald JE, Soong SJ, et al. Final version of 2009 AJCC melanoma staging and classification. J Clin Oncol. 2009;27:6199–6206. - PMC - PubMed

Publication types