

Aging of human short-wave cone pathways
- PMID: 22847416
- PMCID: PMC3421157
- DOI: 10.1073/pnas.1119770109
Aging of human short-wave cone pathways
Abstract
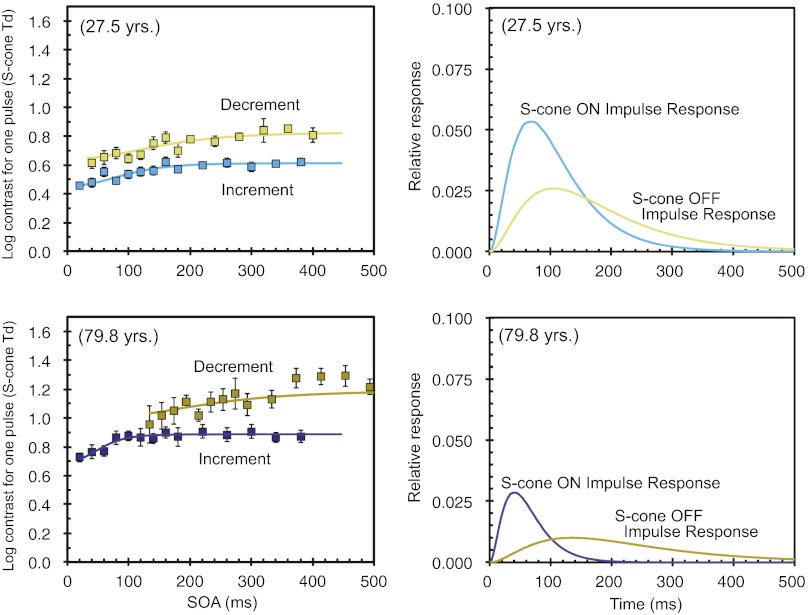
The retinal image is sampled concurrently, and largely independently, by three physiologically and anatomically distinct pathways, each with separate ON and OFF subdivisions. The retinal circuitry giving rise to an ON pathway receiving input from the short-wave-sensitive (S) cones is well understood, but the S-cone OFF circuitry is more controversial. Here, we characterize the temporal properties of putative S-cone ON and OFF pathways in younger and older observers by measuring thresholds for stimuli that produce increases or decreases in S-cone stimulation, while the middle- and long-wave-sensitive cones are unmodulated. We characterize the data in terms of an impulse response function, the theoretical response to a flash of infinitely short duration, from which the response to any temporally varying stimulus may be predicted. Results show that the S-cone response to increments is faster than to decrements, but this difference is significantly greater for older individuals. The impulse response function amplitudes for increment and decrement responses are highly correlated across individuals, whereas the timing is not. This strongly suggests that the amplitude is controlled by neural circuitry that is common to S-cone ON and OFF responses (photoreceptors), whereas the timing is controlled by separate postreceptoral pathways. The slower response of the putative OFF pathway is ascribed to different retinal circuitry, possibly attributable to a sign-inverting amacrine cell not present in the ON pathway. It is significant that this pathway is affected selectively in the elderly by becoming slower, whereas the temporal properties of the S-cone ON response are stable across the life span of an individual.
Conflict of interest statement
The authors declare no conflict of interest.
Figures


Similar articles
-
The Verriest Lecture: Short-wave-sensitive cone pathways across the life span.J Opt Soc Am A Opt Image Sci Vis. 2016 Mar;33(3):A104-22. doi: 10.1364/JOSAA.33.00A104. J Opt Soc Am A Opt Image Sci Vis. 2016. PMID: 26974914 Free PMC article. Review.
-
The impulse response of S-cone pathways in detection of increments and decrements.Vis Neurosci. 2008 May-Jun;25(3):341-7. doi: 10.1017/S0952523808080218. Epub 2008 Mar 6. Vis Neurosci. 2008. PMID: 18321402 Free PMC article.
-
ON and OFF S-cone pathways have different long-wave cone inputs.Vision Res. 2000;40(18):2449-65. doi: 10.1016/s0042-6989(00)00107-3. Vision Res. 2000. PMID: 10915885
-
Impulse response of an S-cone pathway in the aging visual system.J Opt Soc Am A Opt Image Sci Vis. 2006 Jul;23(7):1570-7. doi: 10.1364/josaa.23.001570. J Opt Soc Am A Opt Image Sci Vis. 2006. PMID: 16783419 Free PMC article.
-
S-cone psychophysics.Vis Neurosci. 2014 Mar;31(2):211-25. doi: 10.1017/S0952523814000030. Vis Neurosci. 2014. PMID: 24759446 Review.
Cited by
-
The Verriest Lecture: Short-wave-sensitive cone pathways across the life span.J Opt Soc Am A Opt Image Sci Vis. 2016 Mar;33(3):A104-22. doi: 10.1364/JOSAA.33.00A104. J Opt Soc Am A Opt Image Sci Vis. 2016. PMID: 26974914 Free PMC article. Review.
-
Suppression of Luminance Contrast Sensitivity by Weak Color Presentation.Front Neurosci. 2021 Jun 28;15:668116. doi: 10.3389/fnins.2021.668116. eCollection 2021. Front Neurosci. 2021. PMID: 34262428 Free PMC article.
-
Wavy multistratified amacrine cells in the monkey retina contain immunoreactive secretoneurin.Peptides. 2017 Aug;94:33-42. doi: 10.1016/j.peptides.2017.06.005. Epub 2017 Jun 19. Peptides. 2017. PMID: 28641988 Free PMC article.
-
Transcriptome profiling of aging Drosophila photoreceptors reveals gene expression trends that correlate with visual senescence.BMC Genomics. 2017 Nov 21;18(1):894. doi: 10.1186/s12864-017-4304-3. BMC Genomics. 2017. PMID: 29162050 Free PMC article.
-
Advances in understanding the molecular basis of the first steps in color vision.Prog Retin Eye Res. 2015 Nov;49:46-66. doi: 10.1016/j.preteyeres.2015.07.004. Epub 2015 Jul 15. Prog Retin Eye Res. 2015. PMID: 26187035 Free PMC article. Review.
References
-
- Kaplan E. 2004. The M, P, and K pathways of the primate visual system. The Visual Neurosciences, eds Chalupa LM, Werner JS (MIT Press, Cambridge, MA) pp 481–493.
-
- Nelson R, Kolb H. 2004. ON and OFF pathways in the vertebrate retina and visual system. The Visual Neurosciences, eds Chalupa LM, Werner JS (MIT Press, Cambridge, MA) pp 260–278.
-
- Schiller PH, Sandell JH, Maunsell JHR. Functions of the ON and OFF channels of the visual system. Nature. 1986;322:824–825. - PubMed
-
- Kremers J, Lee BB, Pokorny J, Smith VC. Responses of macaque ganglion cells and human observers to compound periodic waveforms. Vision Res. 1993;33:1997–2011. - PubMed
Publication types
MeSH terms
Grants and funding
LinkOut - more resources
Full Text Sources
Medical
Miscellaneous
