. 2013 Mar 1;521(4):833-59.
doi: 10.1002/cne.23204.

Global expression profiling of globose basal cells and neurogenic progression within the olfactory epithelium

Affiliations

Global expression profiling of globose basal cells and neurogenic progression within the olfactory epithelium

Richard C Krolewski et al. J Comp Neurol. .

Abstract

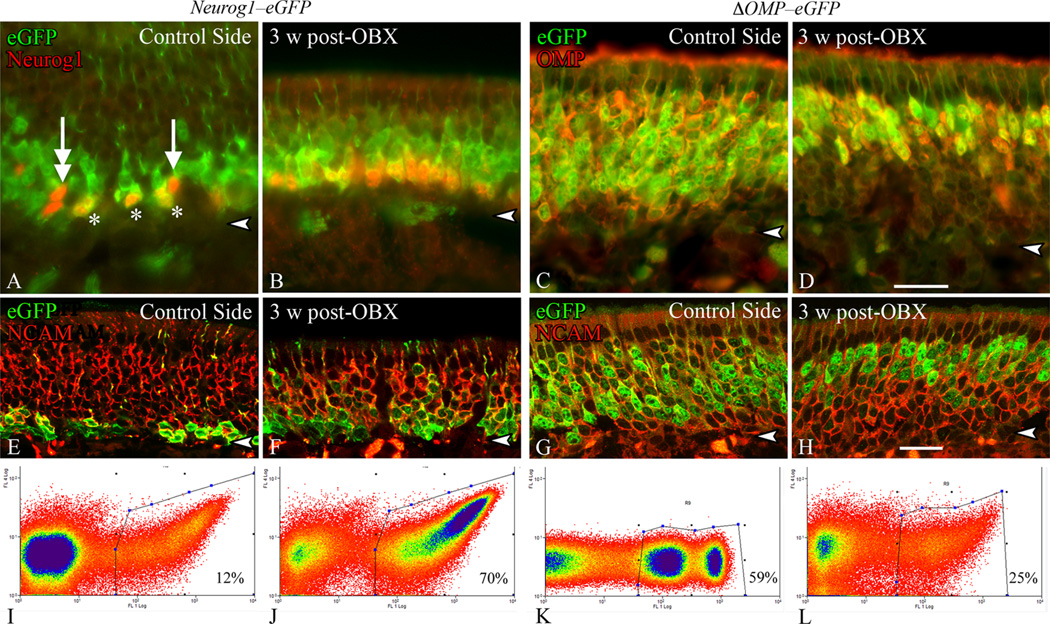
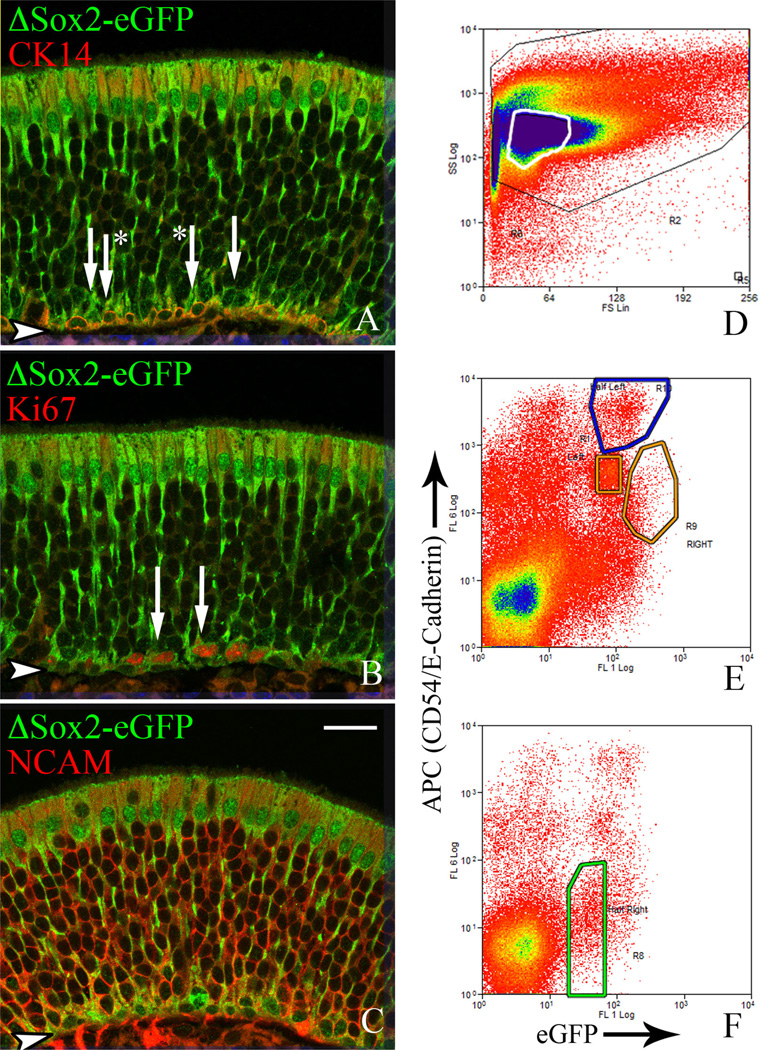
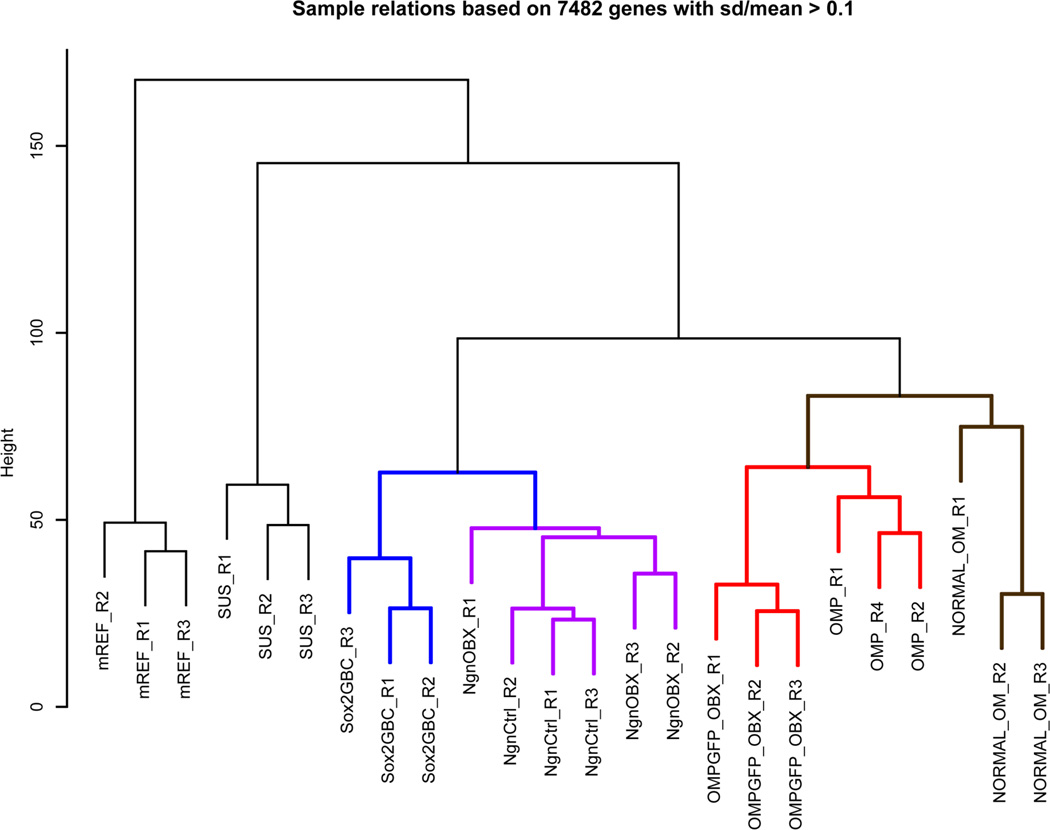
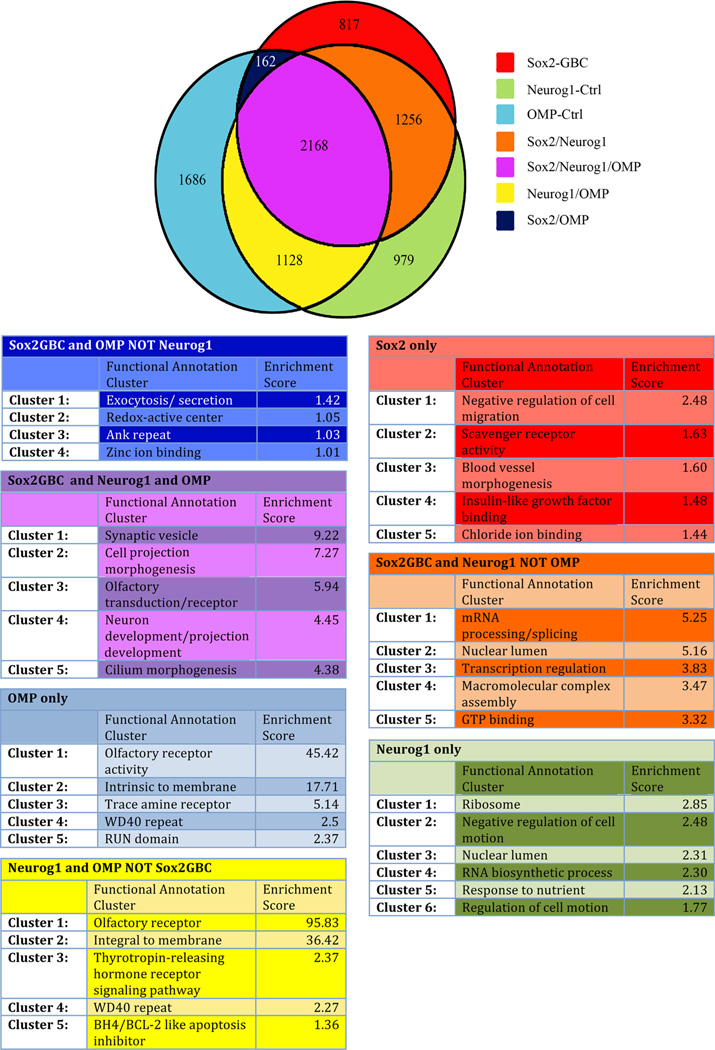
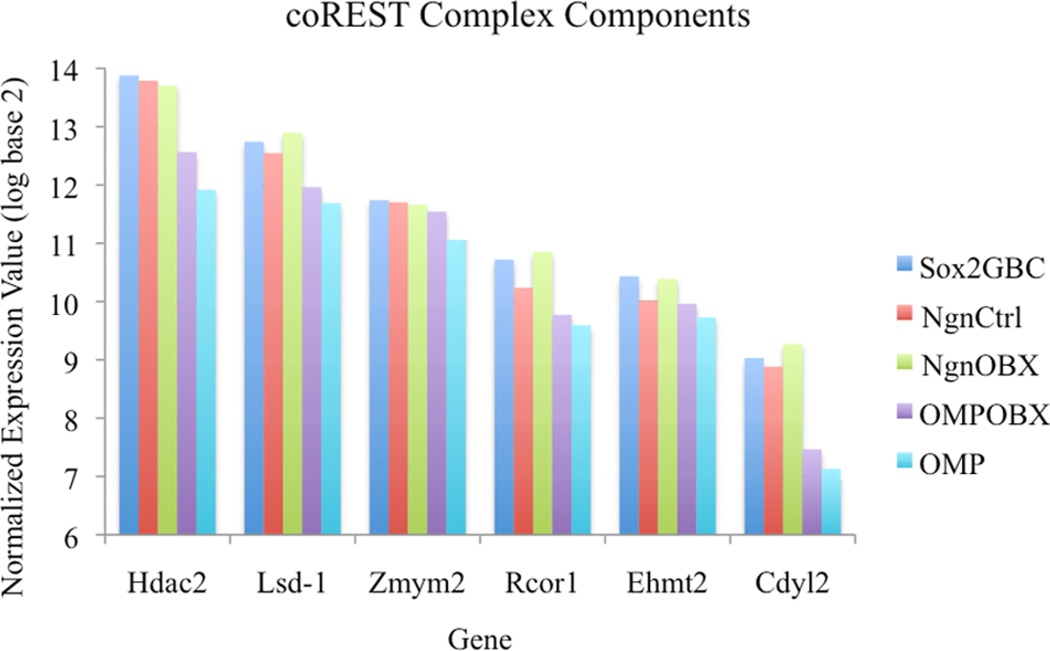
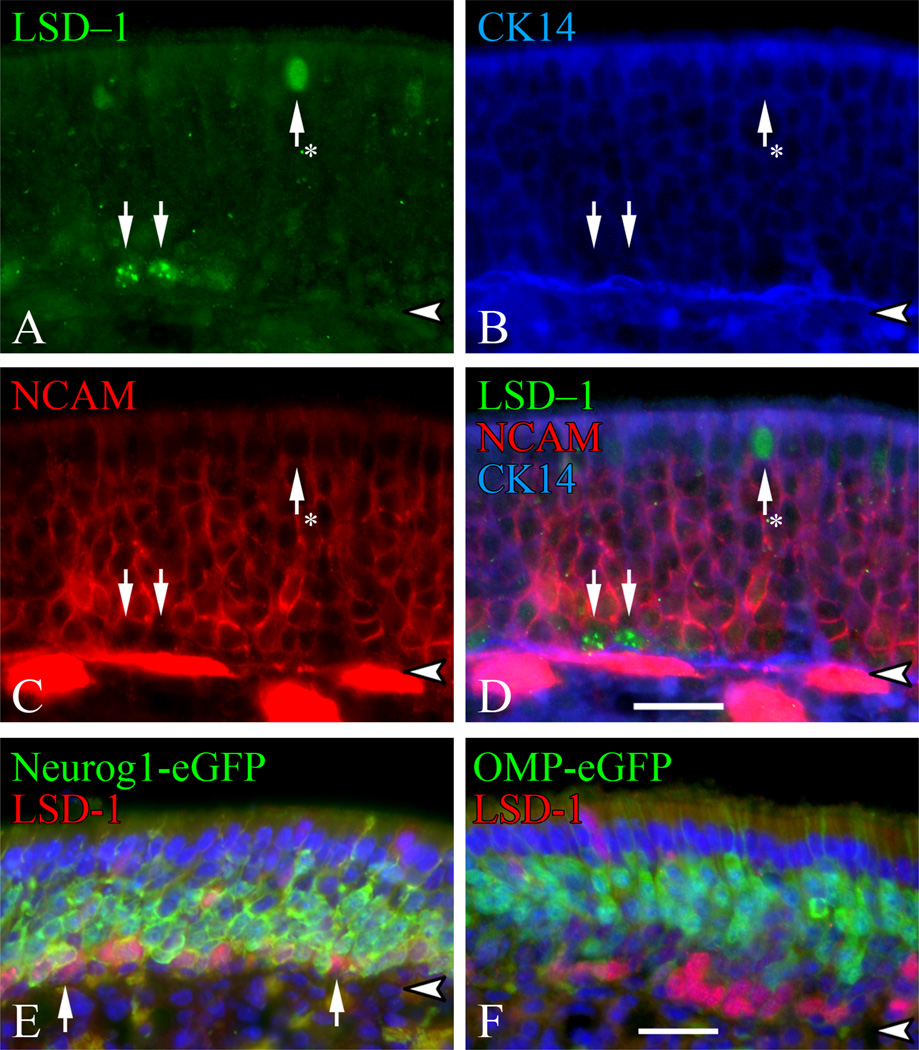
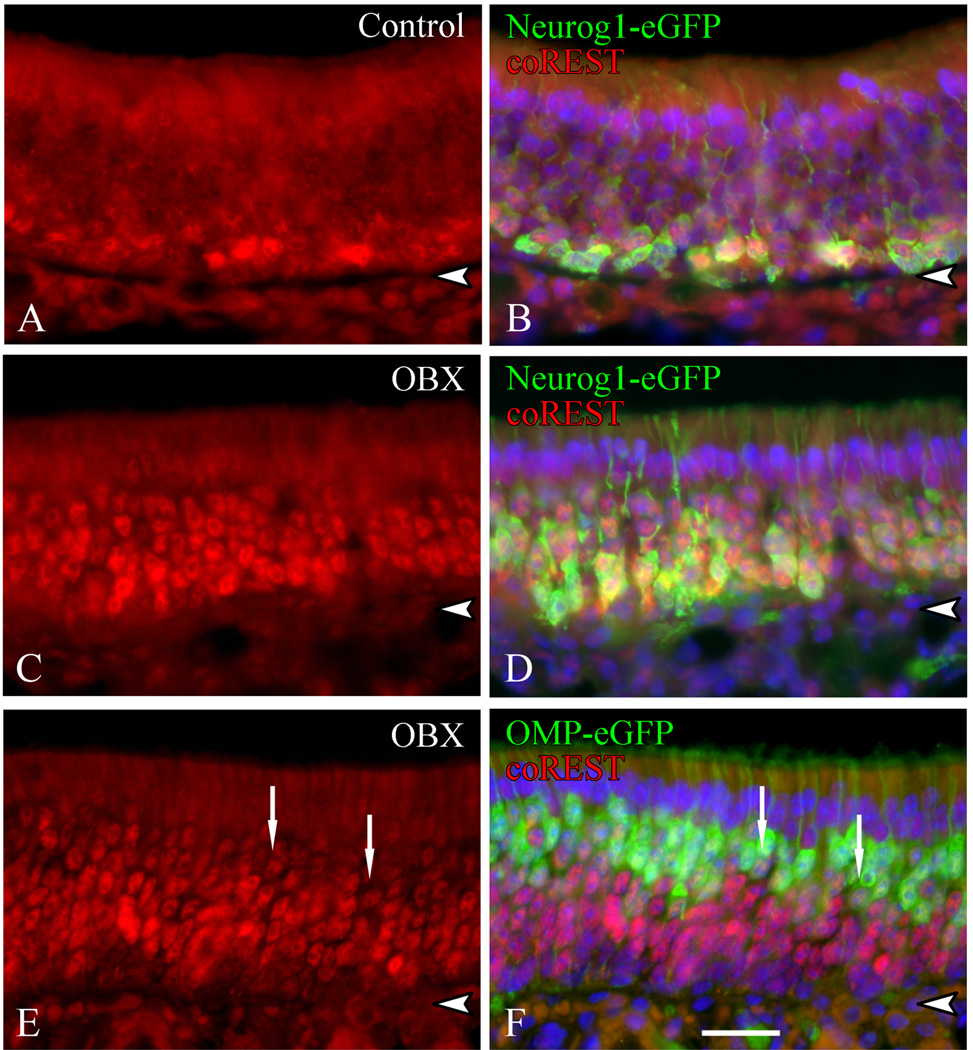
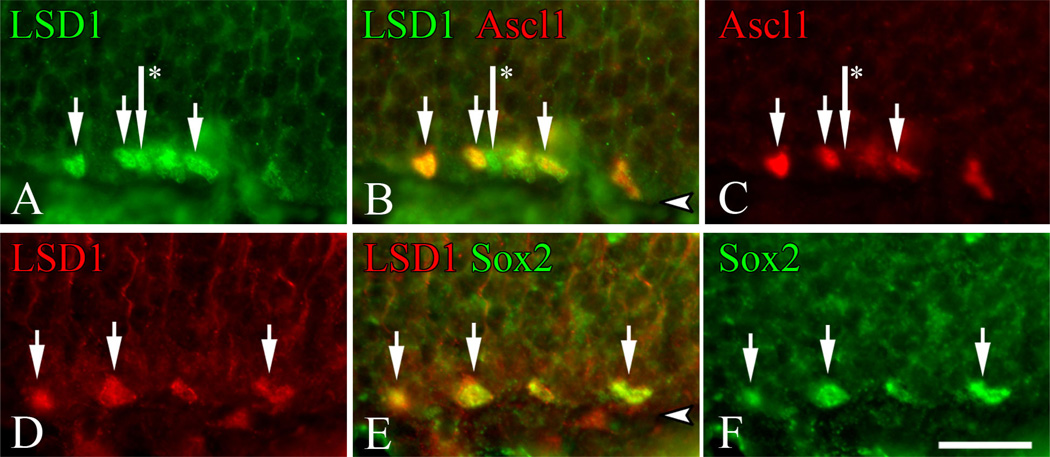
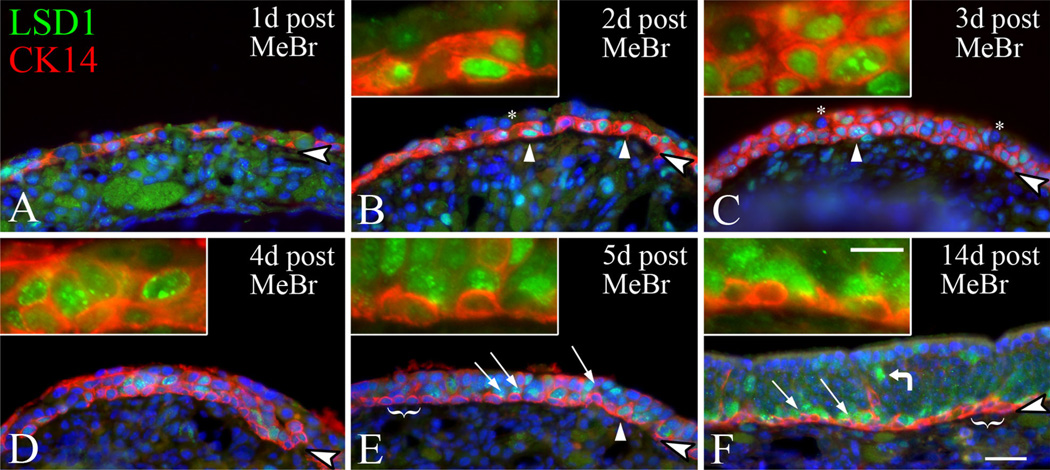
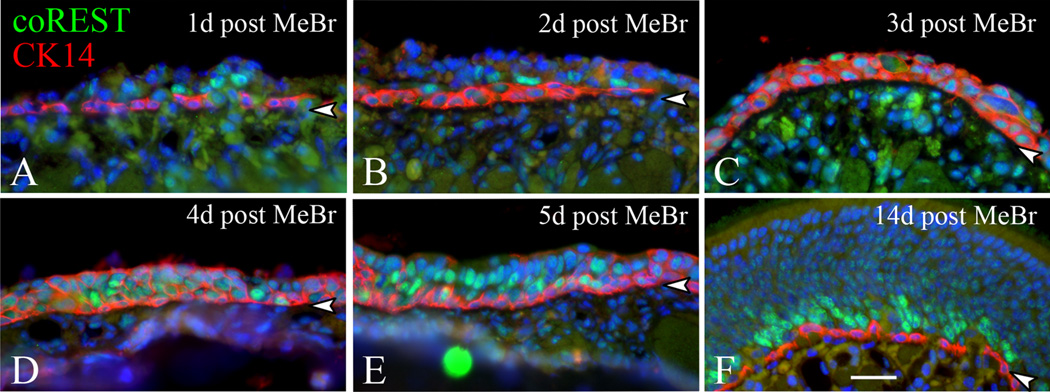
Ongoing, lifelong neurogenesis maintains the neuronal population of the olfactory epithelium in the face of piecemeal neuronal turnover and restores it following wholesale loss. The molecular phenotypes corresponding to different stages along the progression from multipotent globose basal cell (GBC) progenitor to differentiated olfactory sensory neuron are poorly characterized. We used the transgenic expression of enhanced green fluorescent protein (eGFP) and cell surface markers to FACS-isolate ΔSox2-eGFP(+) GBCs, Neurog1-eGFP(+) GBCs and immature neurons, and ΔOMP-eGFP(+) mature neurons from normal adult mice. In addition, the latter two populations were also collected 3 weeks after olfactory bulb ablation, a lesion that results in persistently elevated neurogenesis. Global profiling of mRNA from the populations indicates that all stages of neurogenesis share a cohort of >2,100 genes that are upregulated compared to sustentacular cells. A further cohort of >1,200 genes are specifically upregulated in GBCs as compared to sustentacular cells and differentiated neurons. The increased rate of neurogenesis caused by olfactory bulbectomy had little effect on the transcriptional profile of the Neurog1-eGFP(+) population. In contrast, the abbreviated lifespan of ΔOMP-eGFP(+) neurons born in the absence of the bulb correlated with substantial differences in gene expression as compared to the mature neurons of the normal epithelium. Detailed examination of the specific genes upregulated in the different progenitor populations revealed that the chromatin modifying complex proteins LSD1 and coREST were expressed sequentially in upstream ΔSox2-eGFP(+) GBCs and Neurog1-eGFP(+) GBCs/immature neurons. The expression patterns of these proteins are dynamically regulated after activation of the epithelium by methyl bromide lesion.


Conflict of interest statement

CONFLICT OF INTEREST

The authors declare that no conflict of interest exists.

Figures

Figure 1
Figure 1
Tissue expression and FACS profiles in the neurogenic progression. Tissues harvested from normal Neurog1-eGFP (A,B,E,F,I,J) and ΔOMP-eGFP (C,D,G,H,K,L) mice euthanized 3 weeks post-bulbectomy were stained for various antigens to illustrate the different stages from which RNA was collected for microarray analysis and the resulting FACS profiles. (A–D) The expression of the eGFP transgene relative to the targeted locus is shown; standard fluorescence microscopy of coronal sections. A,B: eGFP(+) cells in normal Neurog1-eGFP mice encompass the pool of immediate neuronal precursors among the GBCs as well as immature neurons. A: Tissue sections from normal adult Neurog1-eGFP mice stained for Neurog1 and eGFP demonstrate that eGFP is expressed in basal cells and immature neurons. The asterisks indicate examples of Neurog1(+)/eGFP(+) cells. 78% of Neurog1(+) cells are also eGFP(+) in unoperated, normal adult OE. The arrow illustrates an example of a Neurog1(+)/eGFP(−) cell and the double arrow indicates a pair of them. While a minority, cells of this type can be found with regularity, presumably due to the fact that GFP has not yet accumulated to detectable levels in them. Many of the eGFP(+) cells are immature neurons, as shown by their lack of Neurog1 expression, more apical position in the epithelium, and the dendrite extending from the cell body toward the surface. B: Sections from transgenic animals killed 3 weeks after unilateral bulbectomy show a dramatic increase in eGFP expression and an expansion apically of the band of Neurog1(+) cells, due to persistently elevated neurogenesis. In the bulbectomized setting, 70% of Neurog1(+) cells are eGFP(+). C,D: eGFP(+) cells in the ΔOMP-eGFP mice encompass the pool of mature neurons in normal epithelium (C) and a population of maturing neurons in bulbectomized epithelium (D). C: Colabeling of OMP and GFP show that the vast majority of OMP(+) mature neurons are eGFP(+). D: After bulbectomy, the transgene maintains fidelity to OMP(+) neurons after bulbectomy. E–H: The expression of the eGFP transgene relative to NCAM, which marks all neurons, and immature neurons most intensely; confocal microscopy of coronal sections. E: In normal Neurog1-eGFP animals, eGFP is detectable in some immature neurons, as shown by costaining with NCAM. F: In Neurog1-eGFP mice 3 weeks after bulbectomy, the population of eGFP(+) neurons is expanded, in keeping with the persistent acceleration of neurogenesis. G: In normal ΔOMP-eGFP mice, there is minimal overlap of eGFP and the intensely NCAM(+) immature neurons. H: In bulbectomized ΔOMP-eGFP mice the population of eGFP(+) neurons is smaller and remains largely but not completely complementary to the intensely NCAM(+) immature neurons. Due to the abbreviated lifespan of neurons born after bulbectomy, the eGFP(+) cells in these animals, represent a smaller population of newly maturing neurons rather than a fully mature population. I–L: FL1 (eGFP) vs. FL4 (no stain) FACS profiles of dissociated cells from the corresponding conditions. The percentage of eGFP(+) cells in each condition is listed in or near the outlined region. The percentages are predicted by and reflect the prevalence of eGFP(+) cells observed in the tissue for both transgenic strains and both conditions (normal vs. bulbectomy). Arrowheads indicate basal lamina. A magenta-green version of the photomicrographs is available online as Supporting Figure 1. Scale bars = 25 mm in D (applies to A–D); 25 µm in H (applies to E–H).
Figure 2
Figure 2
Isolation of eGFP(+) GBCs from ΔSox2-eGFP mice for expression profiling. A–C: ΔSox2-eGFP mice express GFP in GBCs, HBCs, and Sus cells. Coronal sections of OE were stained to demonstrate the cell types expressing GFP. A: eGFP is expressed in two distinct populations of basal cells, HBCs as shown by colabeling with CK14, and GBCs based on exclusion from CK14 (arrows). B: GBCs make up the vast majority of proliferating basal cells, and eGFP colocalizes with Ki67, a marker of proliferation, in these cells (arrows). C: GFP is expressed in GBCs but not the immature neurons downstream as shown by exclusion from NCAM(+) cells. D–F: Strategy for enriching eGFP(+) GBCs from the ΔSox2-eGFP mice by FACS. ΔSox2-eGFP animals were dissociated according to a nonstandard protocol to enrich for GBCs and separate them from HBCs and Sus cells. In this case, the olfactory epithelium was subjected to mechanical disruption without benefit of proteolytic digestion, and the released cells were stained with anti-CD54 (to label HBCs and remove them from the sort) and anti-E-cadherin (to label Sus cells and remove them from the sort). The use of mechanical disruption to isolate a population enriched for GBCs exploits the complex architecture and the junctional attachments of Sus cells and HBCs (as compared to the round, simple GBCs), as well as preserving the cell surface antigens CD54 and E-cadherin for sorting purposes. D: Scatter-gating was used to separate larger and more optically complex cells–characteristic of Sus cells and HBCs–from small, optically simple cells–a property typical of GBCs (the area of the profile outlined in white); cells falling within the indicated gate were then subject to sorting on the basis of GFP and cell surface labeling with the two surface markers in E,F. E,F: FACS profiles of dissociated olfactory epithelial cells from ΔSox2-eGFP mice stained concurrently for the surface markers CD54 (which labels HBCs) and E-cadherin (which labels Sus cells), detected with two separate allophycocyanin (APC)-labeled secondary antibodies in the FL6 channel. E: The populations enriched in Sus cells (areas outlined in orange) and in HBCs (outlined in blue) are shifted well away from the unstained populations, as confirmed by post-hoc analysis (not shown). F: Following scatter-gating as indicated in D, the population of low-intensity eGFP(+) cells that do not stain for CD54 and E-cadherin was isolated and found, on post-hoc analysis, to be largely free of intact Sus cells or HBCs (see text). Note that with the mechanical dissociation protocol a large percentage of the Sus cells show up with decreased eGFP intensity (orange box) relative to the staining in vivo or the FACS profile after enzymatic digestion, presumably because these cells have leaked some soluble GFP as a result of the dissociation. A magenta-green version of the photomicrographs is available online as Supporting Figure 2. Scale bar = 25 µm in C (applies to A–C).
Figure 3
Figure 3
Dendrogram of sample relations. A global comparison of gene expression profiles across the individual samples highlights the degree to which the replicates in each type of cell-sort cluster together and the similarity between that group and all of the others. The samples enriched for different types of GBCs clustered together (blue and purple), while the samples enriched for olfactory sensory neurons clustered together (red and black). The control cell type from the olfactory epithelium that is not part of the neurogenic progression, sustentacular cells (SUS), did not cluster closely with any of the samples from the neurogenic progression. For the two kinds of Neurog1 samples (NgnCtrl, which derive from unoperated Neurog1-eGFP mice, and NgnOBX, which derive from epithelium ipsilateral to the lesion in unilaterally bulbectomized Neurog1-eGFP mice), the variation between replicates within a group was as great as the variation between control and bulb-ablated groups. The replicates of all other cell types segregate together in relative isolation. Signal intensity values from each bead array replicate were normalized and background corrected in Illumina Genome Studio. Sample relations based on >7,000 of the most highly regulated genes were determined using the lumi package for R (Du et al., 2008). mREF designates mouse reference RNA (Stratagene), SUS designates sustentacular cells, NgnCtrl designates Neurog1-Ctrl (unoperated Neurog1-eGFP mice), NgnOBX designates Neurog1-OBX (Neurog1-eGFP mice harvested 3 weeks post-unilateral bulbectomy), OMP designates OMP-Ctrl (unoperated heterozygote ΔOMP-eGFP mice), OMPGFP_OBX designates OMP-OBX (heterozygous ΔOMP-eGFP mice harvested 3 weeks post-bulbectomy), Normal_OM, normal olfactory mucosa.
Figure 4
Figure 4
Overlapping and distinct upregulated genes in the neurogenic progression. Sox2-GBC, Neurog1-Ctrl, and OMP-Ctrl expression data were individually compared to the gene profile for Sus cells. The lists of significantly upregulated genes for each pairwise comparison were used to generate a Venn diagram that depicts the exact number of genes unique to, or shared among, the various conditions. The area for each region is roughly proportional to the number of genes in that area to give a representation of the overlap between different datasets. The red area represents genes uniquely upregulated in Sox2-GBCs (see Materials and Methods and the Results sections for a description of the FACS protocol used to generate this set of cells) but not upregulated in Neurog1-Ctrl (from unoperated Neurog1-eGFP mice) or OMP-Ctrl (from unoperated heterozygote ΔOMP-eGFP mice). Green represents those unique to Neurog1-Ctrl, light blue represents those unique to OMP-Ctrl. Overlapping gene sets are depicted as areas of different colors: orange designates the number of genes that are upregulated in both Sox2-GBC and Neurog1-Ctrl, yellow represents those upregulated in both Neurog1-Ctrl and OMP-Ctrl, dark blue represents those upregulated in both Sox2-GBC and OMP-Ctrl. The central purple area represents those genes upregulated in all three conditions.
Figure 5
Figure 5
coREST complex components are regulated as differentiation proceeds. A list of proteins known to interact with or participate in the coREST corepressor complex was compiled from the literature (Lee et al., 2005; Metzger et al., 2005; Shi et al., 2005; Saleque et al., 2007; Wang et al., 2007, ,b; Cunliffe, 2008). The set of genes that was significantly upregulated at one or more stages within the neurogenic progression (as compared to Sus cells) was interrogated for inclusion of putative coREST components. Six of the coREST-associated genes were significantly upregulated in Sox2-GBC, Neurog1-Ctrl, or Neurog1-OBX samples. The normalized expression values for samples in the neurogenic progression were grouped by gene and plotted as a bar graph, which clearly show that the coREST complex components are upregulated in progenitor cells and decrease in expression as differentiation proceeds.
Figure 6
Figure 6
LSD1 is expressed in GBCs and excluded from mature OSNs. Tissue sections from normal adult olfactory epithelium were examined by triple-label immunohistochemistry. A: LSD1 expression is detected in the nuclei of basal cells (arrows) and occasional apica cells (arrows with asterisks). B: Staining for CK14, a marker of HBCs. C: Staining for NCAM, which is detectable only on neurons and not GBCs (Packard et al., 2011). D: Merged image for all three markers demonstrates that LSD1(+) cells near the basal lamina are NCAM(−) and CK14(−), indicating that these are GBCs. E: The overlap of GFP and LSD1 staining in the Neurog1-eGFP mice is consistent with the expression profile. However, several of the LSD1(+) cells are not colabeled by detectable expression of eGFP and sit below the band of GBCs and neurons that stain with anti-GFP (arrows). F: Likewise, the complete absence of eGFP(+)/LSD1(+) cells in the ΔOMP-eGFP mice also fits with the gene expression data, and substantiates the fall-off in expression as the sensory neurons mature. Arrowheads mark the basal lamina. Scale bars = 25 µm in D (applies to A–C); 25 µm in F (applies to E).
Figure 7
Figure 7
coREST is expressed in more mature cells than LSD1. coREST protein is expressed in eGFP(+) cells in the Neurog1-eGFP mice but extends beyond that stage into the early phase of OMP expression. A,B: coREST labeled nuclei in unlesioned, control epithelium (Control) are confined to the deeper part of the neuronal zone of the OE. Many coREST(+) cells in control Neurog1-eGFP mice are also eGFP(+). However, some coREST(+) neurons, which are a bit more lightly labeled, are found apical to the layer of eGFP(+) cells, suggesting that expression extends beyond the time that LSD1 expression is no longer detectable (cf., Fig. 6E,F). C,D: The population of coREST(+) cells is dramatically expanded along with eGFP(+) population in the bulbectomized Neurog1-eGFP mice. However, a substantia population of coREST(+)/eGFP(−) neurons are found above the belt formed by the Neurog1-eGFP(+) cells; although more lightly labeled, these are evident by comparison with the lack of nuclear staining in the Sus cells in the most apical layer of the epithelium. E,F: In complementary fashion, coREST(+) neurons are concentrated below the eGFP(+) neurons in the bulbectomized ΔOMP-eGFP mice. However, at least some of the eGFP(+) neurons show low but detectable (relative to the absence of staining in the apically located Sus cells) levels of coREST (arrows), which serves as a further indication that coREST expression remains detectable in cells that are further along in the neurogenic progression than is the case for LSD1. Arrowheads mark the basal lamina. Scale bar = 25 µm in F (applies to all).
Figure 8
Figure 8
LSD1 is coexpressed with Ascl1 and Sox2 in GBCs. Tissue sections from normal animals were stained for LSD1 and Ascl1 (A–C) or LSD1 and Sox2 (D–F). A–C: The vast majority of Ascl1(+) (a.k.a. Mash1) cells are also LSD1(+) as seen in the merged image (B) of LSD1 and Ascl1 staining. Arrows indicate double-labeled cells. However, some of the LSD1(+) cells lack detectable Ascl1 (arrows with asterisks). D–F: Many LSD1(+) GBCs are also Sox2(+) as seen in the merged image (E). Arrows indicate colocalization. Arrowheads mark the basal lamina. A magenta-green version of the photomicrographs is available online as Supporting Figure 8. Scale bar = 25 µm in F (applies to all).
Figure 9
Figure 9
LSD1 is first expressed in HBCs followed by GBCs during recovery after MeBr lesion. Tissue sections from animals sacrificed at the indicated times after MeBr lesion were stained for LSD1 to determine the dynamics of the expression in relationship to HBCs, identified by CK14 staining. All panels are counterstained with Hoechst 33258 and insets show areas at higher magnification without the nuclear stain. A: Very few LSD1(+) cells are present at 1 day after lesion. B-D: At 2, 3, and 4 days after lesion, LSD1 is expressed in many CK14(+) cells. Asterisks indicate CK14(−)/LSD1(−) cells. White triangles indicate examples of CK14(+)/LSD1(+) cells. E,F: At later timepoints after lesion, CK14(−)/LSD1(+) GBCs reappear (arrows) and the majority of CK14(+) cells are LSD1(−) (brackets and insets). Bent arrow marks an apically situated LSD1(+) cell. Outlined arrowheads indicate the basal lamina. Scale bars = 25 µm in F (applies to all); 10 µm in inset of F (applies to all insets).
Figure 10
Figure 10
coREST is strongly expressed at later timepoints after MeBr lesion. Tissue sections from animals sacrificed at increasing times after MeBr lesion were stained for coREST to determine the dynamics of the expression in relation to HBCs, identified by CK14 staining. All panels are costained with Hoechst 33258. A–C: coREST(+) cells are very rare at 1–3 days after MeBr lesion and, where expressed, the intensity of staining is weak. D: At 4 days after lesion, more superficially located CK14(+) cells are weakly labeled by anti-coREST antibody, and strongly coREST(+) on occasion. Their position is reminiscent of the CK14 cells that have downregulated p63 expression and detached from the basal lamina as they activate to multipotency after MeBr lesion (Packard et al., 2011). E,F: At 5 and 14 days after esion, the vast majority of strongly labeled coREST(+) cells are CK14(−). Arrowheads indicate basal lamina. Scale bar = 25 µm in F (applies to all).

Similar articles

Cited by

References

    1. Agustsson T, Nilsson M, Henriksson G, Arnelo U, Juto JE, Lundell L. Treatment of postoperative esophagorespiratory fistulas with dual self-expanding metal stents. World J Surg. 2009;33:1224–1228. - PubMed
    1. Andres ME, Burger C, Peral-Rubio MJ, Battaglioli E, Anderson ME, Grimes J, Dallman J, Ballas N, Mandel G. CoR-EST: a functional corepressor required for regulation of neural-specific gene expression. Proc Natl Acad Sci U S A. 1999;96:9873–9878. - PMC - PubMed
    1. Aubert J, Stavridis MP, Tweedie S, O’Reilly M, Vierlinger K, Li M, Ghazal P, Pratt T, Mason JO, Roy D, Smith A. Screening for mammalian neural genes via fluorescence-activated cell sorter purification of neural precursors from Sox1-gfp knock-in mice. Proc Natl Acad Sci U S A. 2003;100(Suppl 1):11836–11841. - PMC - PubMed
    1. Baker H, Grillo M, Margolis FL. Biochemical and immunocytochemical characterization of olfactory marker protein in the rodent central nervous system. J Comp Neurol. 1989;285:246–261. - PubMed
    1. Barraud P, He X, Zhao C, Ibanez C, Raha-Chowdhury R, Cald-well MA, Franklin RJ. Contrasting effects of basic fibroblast growth factor and epidermal growth factor on mouse neonatal olfactory mucosa cells. Eur J Neurosci. 2007;26:3345–3357. - PubMed

Publication types

LinkOut - more resources