. 2013 Jul 4;32(27):3286-95.
doi: 10.1038/onc.2012.334. Epub 2012 Jul 30.

Mutant p53 gain-of-function induces epithelial-mesenchymal transition through modulation of the miR-130b-ZEB1 axis

Affiliations
Free PMC article

Mutant p53 gain-of-function induces epithelial-mesenchymal transition through modulation of the miR-130b-ZEB1 axis

P Dong et al. Oncogene. .
Free PMC article

Abstract

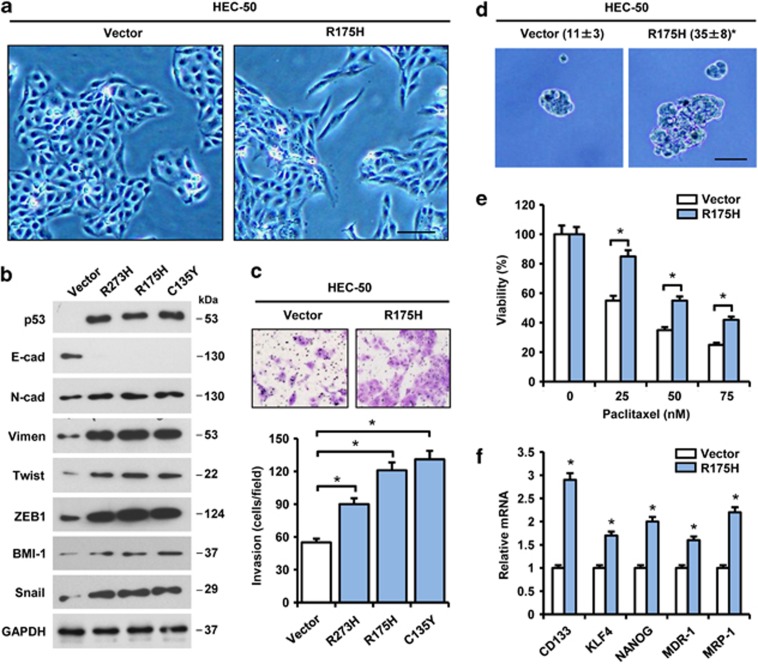
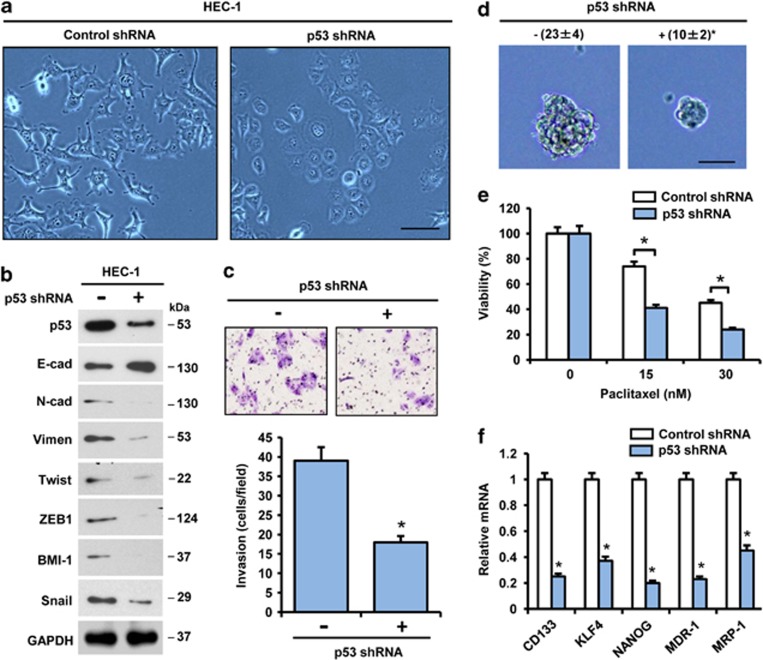
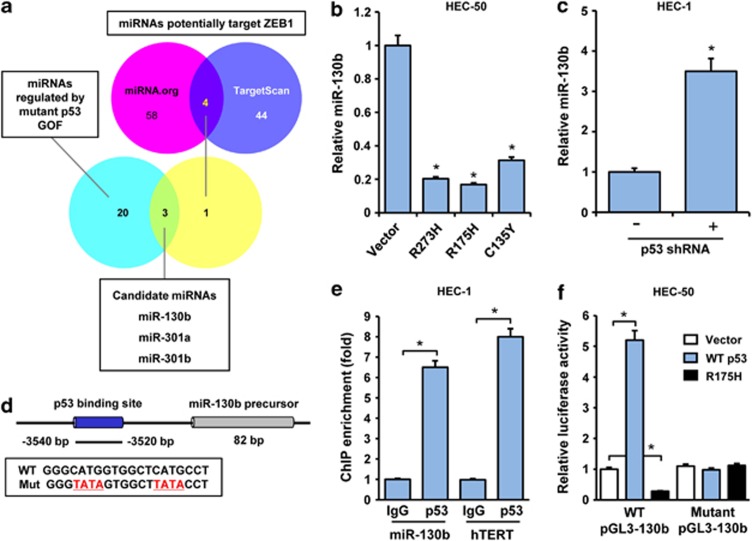
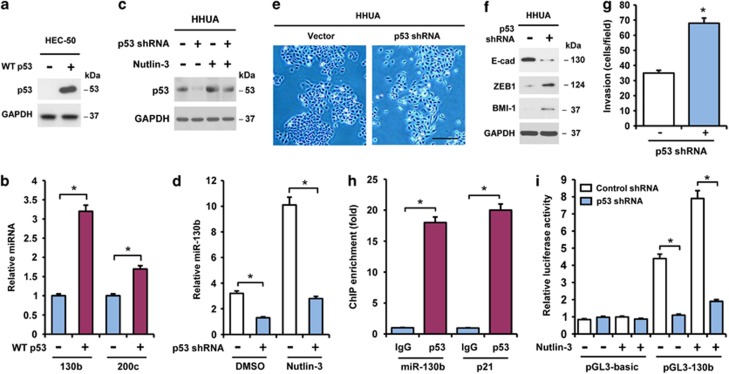
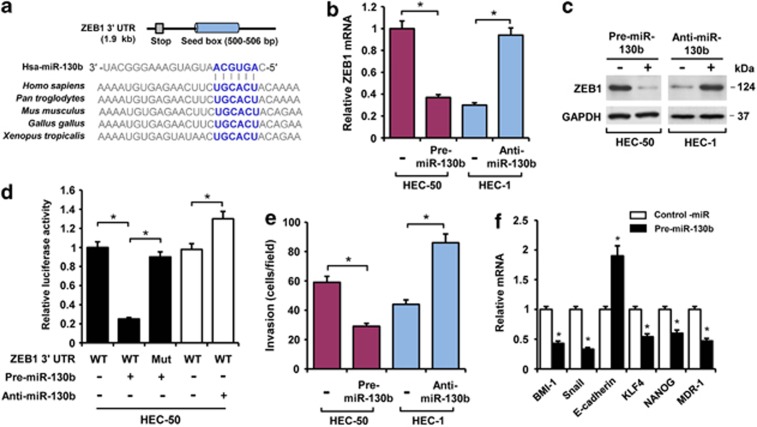
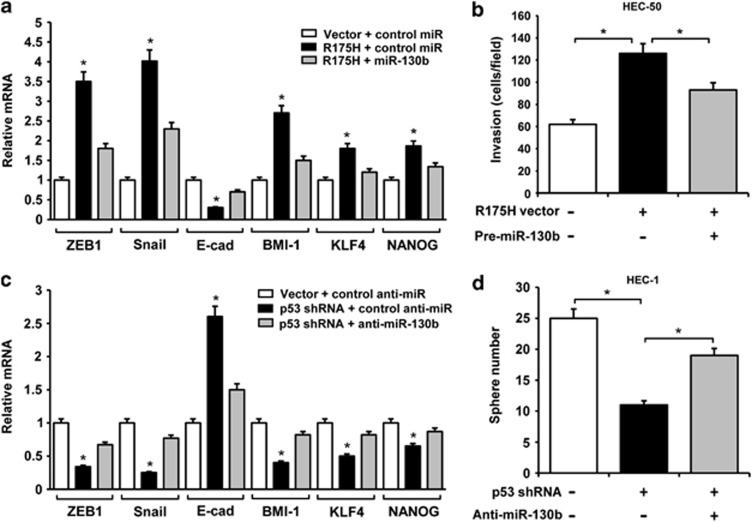
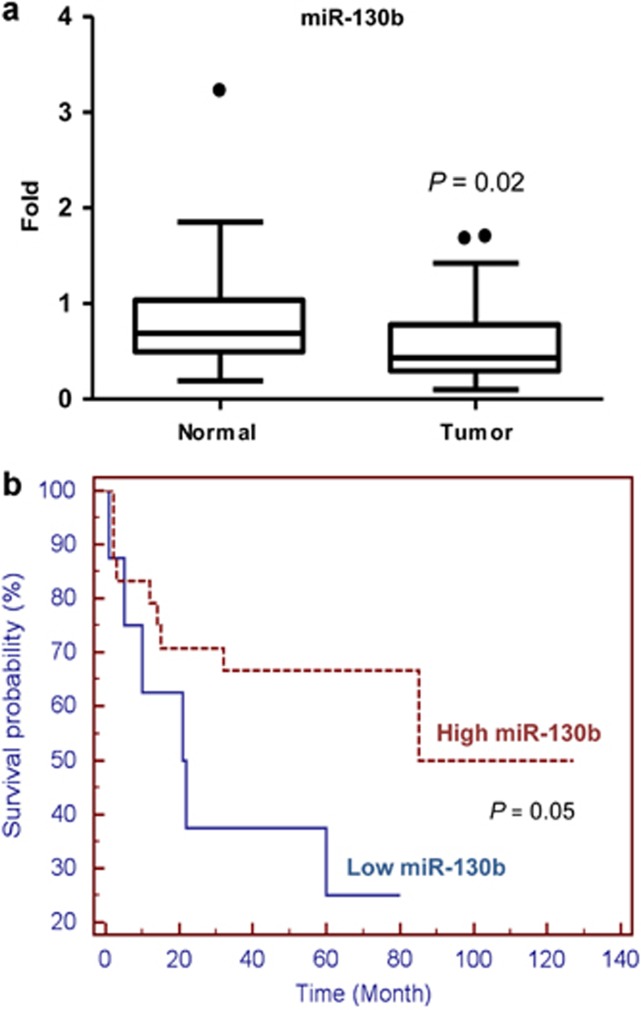
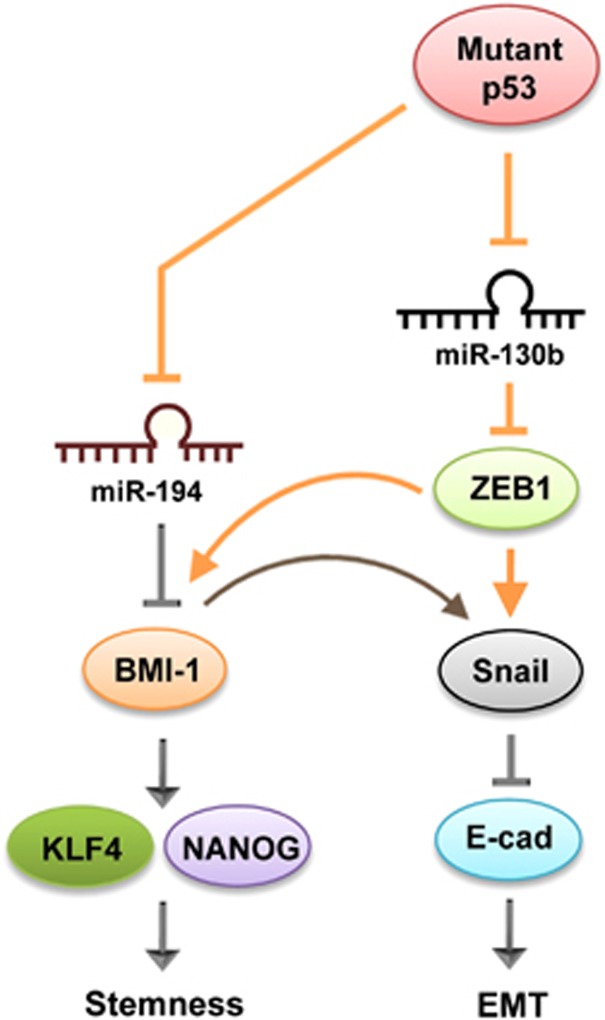
The tumor suppressor gene p53 has been implicated in the regulation of epithelial-mesenchymal transition (EMT) and tumor metastasis by regulating microRNA (miRNA) expression. Here, we report that mutant p53 exerts oncogenic functions and promotes EMT in endometrial cancer (EC) by directly binding to the promoter of miR-130b (a negative regulator of ZEB1) and inhibiting its transcription. We transduced p53 mutants into p53-null EC cells, profiled the miRNA expression by miRNA microarray and identified miR-130b as a potential target of mutant p53. Ectopic expression of p53 mutants repressed the expression of miR-130b and triggered ZEB1-dependent EMT and cancer cell invasion. Loss of an endogenous p53 mutation increased the expression of miR-130b, which resulted in reduced ZEB1 expression and attenuation of the EMT phenotype. Furthermore, re-expression of miR-130b suppressed mutant p53-induced EMT and ZEB1 expression. Importantly, the expression of miR-130 was significantly reduced in EC tissues, and patients with higher expression levels of miR-130b survived longer. These data provide a novel understanding of the roles of p53 gain-of-function mutations in accelerating tumor progression and metastasis through modulation of the miR-130b-ZEB1 axis.


Figures

Figure 1
Figure 1
Mutant p53 GOF contributes to EMT in EC cells. (a) Morphology of endometrial cancer HEC-50 cells containing a control vector or mutant p53 R175H. Scale bars represent 100 μm. (b) Protein expression of p53 and EMT markers as analyzed by immunoblot. (c) Invasion of HEC-50 cells following overexpression of mutant p53s (mean±s.d.; n=3; *P<0.01). Representative images of invaded cells are shown. (d) Images indicate mammosphere formation in HEC-50 cells expressing the indicated constructs. The number of spheres obtained from 1000 cells at 12 days after plating (scale bar=50 μm; mean±s.d.; n=3; *P<0.01). (e) Mutant R175H- or empty vector-transfected HEC-50 cells were treated with paclitaxel (0, 25, 50 and 75 nmol/l) for 48 h. Cell viability were determined by 3-(4,5-dimethylthiazol-2-yl)-2,5-diphenyltetrazolium bromide assay (mean±s.d.; n=3; *P<0.01). (f) Relative mRNA expression of stemness markers (normalized to GAPDH) in HEC-50 cells transfected with control or R175H vector, determined by qRT–PCR (mean±s.d.; n=4; *P<0.01).
Figure 2
Figure 2
Knockdown of mutant p53 in EC cells causes a reversal of EMT and inhibition of cell invasion ability. (a) Morphology of endometrial cancer HEC-1 cells transfected with control shRNA vector or p53 shRNA vector (scale bar=100 μm). (b) Protein levels of p53 and EMT markers as analyzed by western blot. (c) Invasion of HEC-1 cells after p53 shRNA transfection (mean±s.d.; n=3; *P<0.01). Representative images of invaded cells are shown. (d) Images show mammosphere formation in HEC-1 cells after p53 silencing by shRNA. Number of spheres obtained from 1000 cells at 12 days after plating (scale bar=50 μm; mean±s.d.; n=3; *P<0.01). (e) Control- or p53 shRNA-transfected HEC-1 cells were treated with paclitaxel (0, 15, and 30 nmol/l) for 48 h. Cell viability was determined by 3-(4,5-dimethylthiazol-2-yl)-2,5-diphenyltetrazolium bromide assay (mean±s.d.; n=3; *P<0.01). (f) Relative mRNA expression of stemness markers (normalized to GAPDH) in HEC-1 cells after p53 silencing, determined by qRT–PCR (mean±s.d.; n=4; *P<0.01).
Figure 3
Figure 3
Mutant p53 binds to and transrepresses the promoter of miR-130b. (a) Schematic of algorithm used to select candidate microRNAs that potentially target ZEB1, and are negatively regulated by mutant p53s. (b, c) Relative miR-130b expression levels in HEC-50 cells transfected with mutant p53 vector (b), or in HEC-1 cells after p53 silencing by shRNA (c), were determined by qRT–PCR (mean±s.d.; n=4; *P<0.01). (d) Location and sequence of predicted p53-binding sites in the promoter of miR-130b gene. Mutated residues (red) are indicated at the bottom. (e) ChIP–qPCR analysis of mutant p53 (DO-7 antibody) binding to the miR-130b promoter region in HEC-50 cells. Human telomerase (hTERT) was used as a positive control. The fold enrichment over the IgG control is represented (mean±s.d.; n=3; *P<0.01). (f) HEC-50 cells were transfected with luciferase reporter plasmid pGL3-130b or empty pGL3-basic vector, along with control vector, wild-type p53 or mutant p53 R175H vector, and relative luciferase activity were assayed (mean±s.d.; n=3; *P<0.01). All qRT–PCR or luciferase values were normalized to GAPDH or Renilla activity, respectively.
Figure 4
Figure 4
WT p53 transactivates the promoter of miR-130b. (a) WT p53 protein level in HEC-50 cells transfected with WT p53 expression vector or control vector. (b) qRT–PCR for miR-130b and miR-200c in HEC-50 cells transfected with WT p53 expression vector or control vector (mean±s.d.; n=4; *P<0.01). (c, d) HHUA cells transfected with p53 shRNA vector or control vector were treated with 5 μmol/l of Nutlin-3 or dimethyl sulfoxide (DMSO) for 12 h. WT p53 protein (c) and miR-130b expression (d) were detected by western blot analysis and qRT–PCR (mean±s.d.; n=4; *P<0.01), respectively. (e) Morphology of HHUA cells after p53 silencing. Scale bars represent 200 μm. (f) Western blot analysis for EMT markers in HHUA cells after p53 silencing. (g) Invasion assay of HHUA cells after transfection with p53 shRNA (mean±s.d.; n=3; *P<0.01). (h) ChIP–qPCR analysis of WT p53 (DO-7 antibody) binding to the miR-130b promoter region in HHUA cells. p21 was used as a positive control. The fold enrichment over the IgG control is represented (mean±s.d.; n=3; *P<0.01). (i) Indicated HHUA cells were transfected with luciferase reporter plasmid pGL3-130b or empty pGL3-basic vector, and treated with 5 μmol/l of Nutlin-3 or DMSO for 12 h. Relative luciferase activity was determined (mean±s.d.; n=3; *P<0.01). All qPCR or luciferase values were normalized to GAPDH or Renilla activity, respectively.
Figure 5
Figure 5
miR-130b impairs cell invasion by targeting ZEB1. (a) Schematic representation of the 3′-UTR of ZEB1 with the predicted target site for miR-130b. Sequence of mature miR-130b reveals the evolutionary conservation of the target site across five species (below). (b, c, e) qRT–PCR (b, mean±s.d.; n=3; *P<0.05), western blotting (c) and cell invasion assay (e, mean±s.d.; n=3; *P<0.01) of HEC-50 or HEC-1 cells transfected with pre-miR-130b or anti-miR-130b, respectively. (d) Reporter constructs containing either wild-type ZEB1 3′-UTR or ZEB1 3′-UTR with mutation at the predicted miR-130b target sequence were co-transfected into HEC-50 cells, along with miR-130b, control miRNA, anti-miR-130b or control anti-miRNA. Relative luciferase activity was assayed (mean±s.d.; n=3; *P<0.01). (f) Expression of EMT and stemness markers in HEC-50 cells transfected with pre-130b or control miRNA were analyzed by qRT–PCR (mean±s.d.; n=4; *P<0.01). All qPCR or luciferase values were normalized to GAPDH or Renilla activity, respectively.
Figure 6
Figure 6
The p53 GOF mutants stimulate EMT features through downregulation of miR-130b. (a, c) qRT–PCR for EMT and stemness markers in HEC-50 cells (a) or in HEC-1 cells (c) expressing indicated constructs, and pre-miRNAs and anti-miRNAs (mean±s.d.; n=3; *P<0.01). (b) Invasion assay of HEC-50 cells expressing indicated vectors and pre-miRNAs (mean±s.d.; n=3; *P<0.01). (d) Sphere formation assay of HEC-1 cells expressing indicated vectors and anti-miRNAs (mean±s.d.; n=3; *P<0.01).
Figure 7
Figure 7
Association of miR-130b expression levels with prognosis of EC patients. (a) The expression of miR-130b was significantly reduced in EC patients compared with paired normal specimens. (b) Kaplan–Meier overall survival curve according to miR-130b expression levels in EC patients (P=0.05).
Figure 8
Figure 8
Schematic model indicating proposed mechanisms by which mutant p53 GOF induces EMT. Mutant p53 GOF induces EMT, through direct transrepression of miR-130b, an inhibitor of ZEB1, and subsequent activation of ZEB1-dependent signaling pathway.

References

    1. Kang Y, Massagué J. Epithelial-mesenchymal transitions: twist in development and metastasis. Cell. 2004;118:277–279. - PubMed
    1. Korpal M, Lee ES, Hu G, Kang Y. The miR-200 family inhibits epithelial-mesenchymal transition and cancer cell migration by direct targeting of E-cadherin transcriptional repressors ZEB1 and ZEB2. J Biol Chem. 2008;283:14910–14914. - PMC - PubMed
    1. Li Y, VandenBoom TG, Kong D, Wang Z, Ali S, Philip PA, et al. Up-regulation of miR-200 and let-7 by natural agents leads to the reversal of epithelial-to-mesenchymal transition in gemcitabine-resistant pancreatic cancer cells. Cancer Res. 2009;69:6704–6712. - PMC - PubMed
    1. Meng Z, Fu X, Chen X, Zeng S, Tian Y, Jove R, et al. miR-194 is a marker of hepatic epithelial cells and suppresses metastasis of liver cancer cells in mice. Hepatology. 2010;52:2148–2157. - PMC - PubMed
    1. Kim T, Veronese A, Pichiorri F, Lee TJ, Jeon YJ, Volinia S, et al. p53 regulates epithelial-mesenchymal transition through microRNAs targeting ZEB1 and ZEB2. J Exp Med. 2011;208:875–883. - PMC - PubMed

MeSH terms