Controlled Clinical Trial
. 2012 Oct 15;590(20):5211-30.
doi: 10.1113/jphysiol.2012.240267. Epub 2012 Jul 30.

The time course of the adaptations of human muscle proteome to bed rest and the underlying mechanisms

Affiliations
Controlled Clinical Trial

The time course of the adaptations of human muscle proteome to bed rest and the underlying mechanisms

Lorenza Brocca et al. J Physiol. .

Abstract

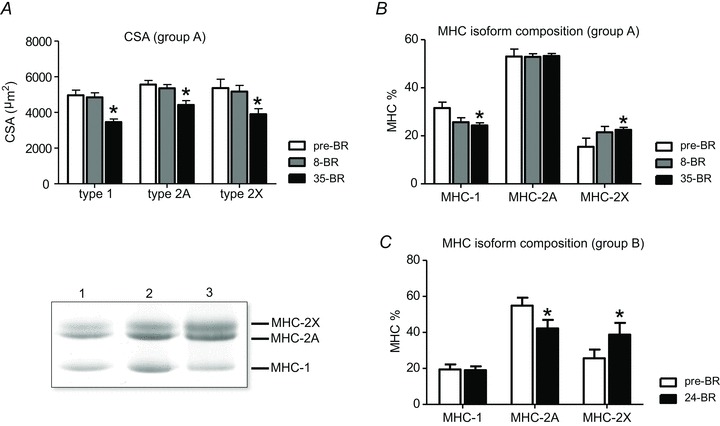
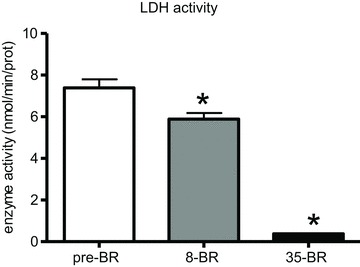
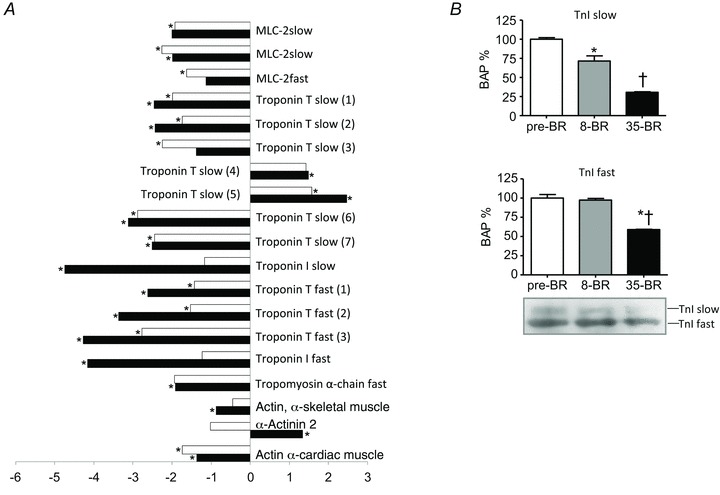
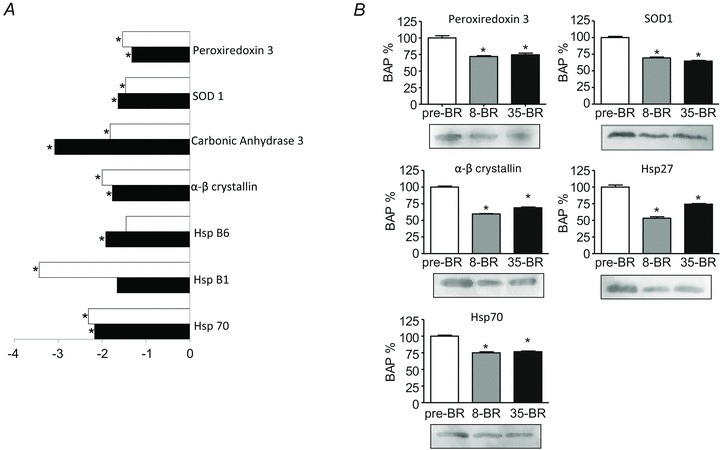
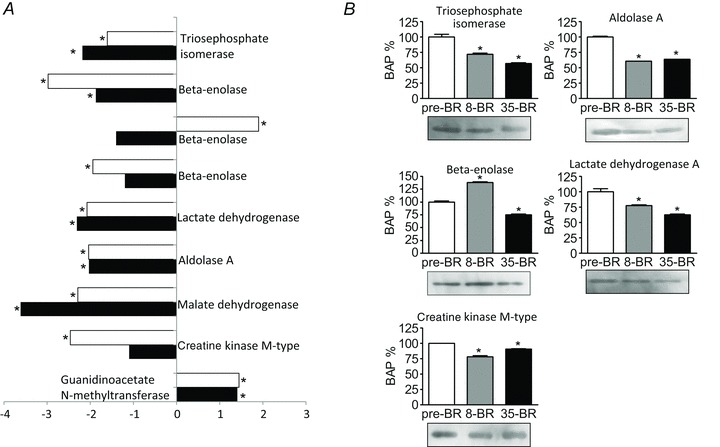
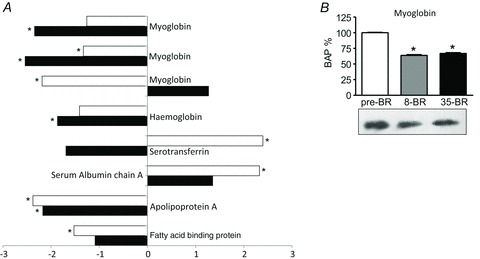
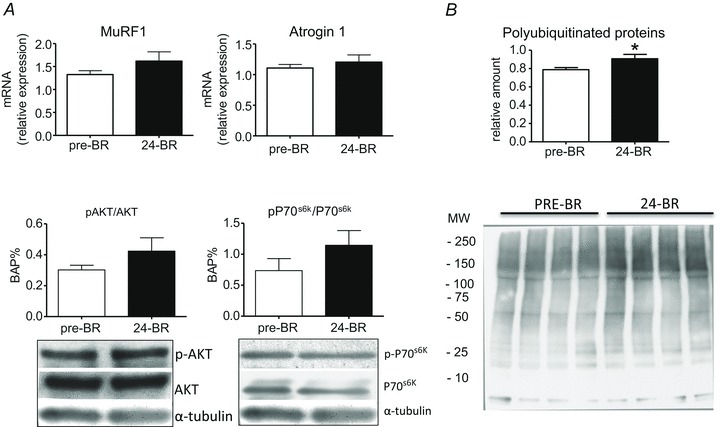
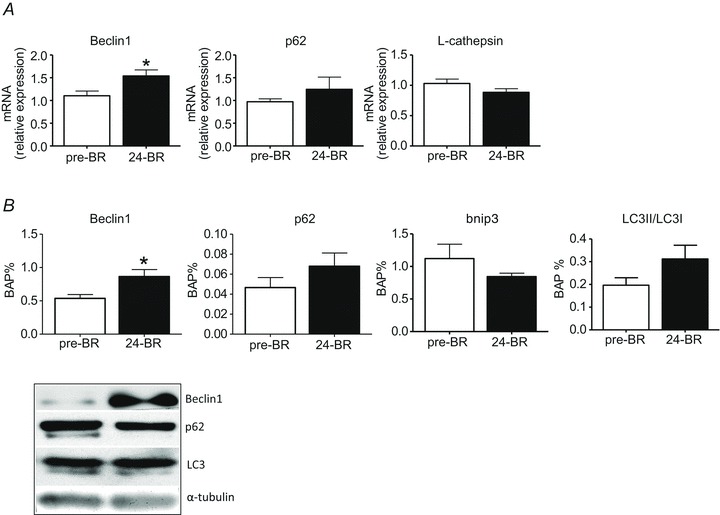
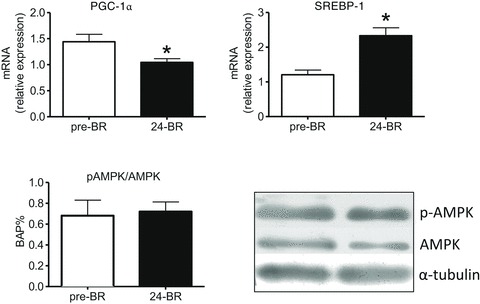
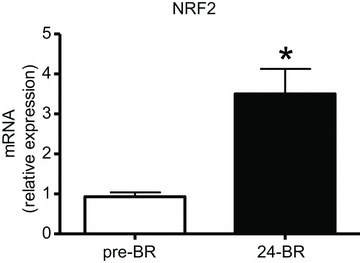
In order to get a comprehensive picture of the complex adaptations of human skeletal muscle to disuse and further the understanding of the underlying mechanisms, we participated in two bed rest campaigns, one lasting 35 days and one 24 days. In the first bed rest (BR) campaign, myofibrillar proteins, metabolic enzymes and antioxidant defence systems were found to be down-regulated both post-8 days and post-35 days BR by proteomic analysis of vastus lateralis muscle samples from nine subjects. Such profound alterations occurred early (post-8 days BR), before disuse atrophy developed, and persisted through BR (post-35 days BR). To understand the mechanisms underlying the protein adaptations observed, muscle biopsies from the second bed rest campaign (nine subjects) were used to evaluate the adaptations of master controllers of the balance between muscle protein breakdown and muscle protein synthesis (MuRF-1 and atrogin-1; Akt and p70S6K), of autophagy (Beclin-1, p62, LC3, bnip3, cathepsin-L), of expression of antioxidant defence systems (NRF2) and of energy metabolism (PGC-1α, SREBP-1, AMPK). The results indicate that: (i) redox imbalance and remodelling of muscle proteome occur early and persist through BR; (ii) impaired energy metabolism is an early and persistent phenomenon comprising both the oxidative and glycolytic one; (iii) although both major catabolic systems, ubiquitin proteasome and autophagy, could contribute to the progression of atrophy late into BR, a decreased protein synthesis cannot be ruled out; (iv) a decreased PGC-1α, with the concurrence of SREBP-1 up-regulation, is a likely trigger of metabolic impairment, whereas the AMPK pathway is unaltered.


Figures

Figure 1
Figure 1. The effect of BR on muscle fibre size and myosin heavy chain isoform distribution
A, cross sectional area (CSA) of type 1, 2A and 2X fibres, identified on the basis of MHC isoform content, pre-BR, post-8d BR (8-BR) and post-35d BR (35-BR). B and C, MHC isoform distribution of subject group A (first BR campaign) pre-BR, post-8d BR and post-35d BR and of subject group B (second BR campaign) pre-BR and post-24d BR (24-BR). Lower left panel, representative SDS-PAGE gels used for determination of MHC isoform relative content of muscle samples.
Figure 6
Figure 6. The effect of 8 and 35 days of BR on lactate dehydrogenase activity of vastus lateralis muscle (subject group A)
8-BR, post-8d BR; 35-BR, post-35d BR. *Significantly different from all other groups.
Figure 2
Figure 2. Differentially expressed myofibrillar proteins of vastus lateralis muscles following 8 and 35 days of BR compared to pre-BR (subject group A)
A, bar graph of volume ratios of differentially expressed proteins. The numbers on the x-axis indicate the ratio between the average volume of a given protein expressed post-8d BR (open bars) or post-35d BR (filled bars) and the average volume of the same protein pre-BR. Positive numbers (on the right) indicate up-regulation of a protein, whereas negative numbers (on the left) indicate down-regulation. *Significantly different from pre-BR. The full information on the proteins and the numerical ratios between volumes are reported in Supplemental Table 1. B, Western blot analysis of the content in troponin-I (TnI) slow and fast isoforms pre-BR, post-8d BR (8-BR) and post-35d BR (35-BR). *Significantly different from pre-BR; †significantly different from post-8 BR.
Figure 3
Figure 3. Differentially expressed antioxidant defence systems of vastus lateralis muscles following 8 and 35 days of BR compared to pre-BR (subject group A)
A, bar graph of volume ratios of differentially expressed proteins. The same approach to represent differentially expressed proteins was used as in Fig. 3. *Significantly different from pre-BR. The full information on the proteins and the numerical ratios between volumes are reported in Supplemental Table 1. B, Western blot analysis of the content in peroxiredoxin 3, α,β-crystallin, Hsp70, SOD1, Hsp27 pre-BR, post-8d BR (8-BR) and post-35d BR (35-BR). *Significantly different from pre-BR.
Figure 4
Figure 4. Differentially expressed energy production systems of vastus lateralis muscles following 8 and 35 days of BR compared to pre-BR (subject group A)
A, bar graph of volume ratios of differentially expressed proteins. The same approach to represent differentially expressed proteins was used as in Fig. 3. The full information on the proteins and the numerical ratios between volumes are reported in Supplemental Table 1. *Significantly different from pre-BR. B, Western blot analysis of the content in triosephosphate isomerase, β-enolase, creatine kinase, aldolase A, lactate dehydrogenase A post-8d BR (8-BR) and post-35d BR(35-BR). *Significantly different from pre-BR.
Figure 5
Figure 5. Differentially expressed transport proteins of vastus lateralis muscles following 8 and 35 days of BR compared to pre-BR (subject group A)
A, bar graph of volume ratios of differentially expressed proteins. The same approach to represent differentially expressed proteins was used as in Fig. 3. The full information on the proteins and the numerical ratios between volumes are reported in Supplemental Table 1. *Significantly different from pre-BR. B, Western blot analysis of myoglobin content pre-BR, post-8d BR (8-BR) and post-35d BR (35-BR). *Significantly different from pre-BR.
Figure 7
Figure 7. The effect of 24 days of BR on the expression of two major atrogenes (MuRF-1 and atrogin-1) and on the activity of two major kinases of the Akt/mTOR pathway (Akt and p70) in vastus lateralis muscle (subject group B)
A, MuRF-1 and atrogin-1 expression was assessed by quantitative RT-PCR. The activity of Akt and p70 was assessed by Western blot analysis of the ratio between the content in the phosphorylated and total forms. 24d BR, post-24d BR. B, relative content (upper panel) and representative blot (lower panel) of polyubiquitinated proteins in vastus lateralis muscle post-24d BR (subject group B). *Significantly different from pre-BR.
Figure 8
Figure 8. The effect of 24 days of BR on autophagy markers in vastus lateralis muscles (subject group B)
A, Beclin-1, p62 and L-cathepsin expression by quantitative RT-PCR. B, content in Beclin-1, p62, bnip3 and the ratio between the content in II and I forms of LC3 by Western blotting. C, representative Western blots of proteins in panel B. 24d BR, post-24d BR. *Significantly different from pre-BR.
Figure 9
Figure 9. The effect of 24 days of BR on PGC-1α and SREBP-1 expression determined by quantitative RT-PCR and on the ratio between the phosphorylated and total forms of AMP-kinase (AMPK) determined by Western blotting in vastus lateralis muscle (subject group B)
In the lower right panel, representative Western blots for pAMPK. 24d BR, post-24d BR. *Significantly different from pre-BR.
Figure 10
Figure 10. The effect of 24 days of BR on NRF2 expression determined by quantitative RT-PCR in vastus lateralis muscles (subject group B)
24 d BR, post-24d BR. *Significantly different from pre-BR.

Comment in

References

    1. Acheson KJ, Decombaz J, Piguet-Welsch C, Montigon F, Decarli B, Bartholdi I, Fern EB. Energy, protein, and substrate metabolism in simulated microgravity. Am J Physiol Regul Integr Comp Physiol. 1995;269:R252–260. - PubMed
    1. Adams GR, Caiozzo VJ, Baldwin KM. Skeletal muscle unweighting: spaceflight and ground-based models. J Appl Physiol. 2003;95:2185–2201. - PubMed
    1. Agostini F, Heer M, Guarnieri G, Biolo G. Physical inactivity decreases whole body glutamine turnover independently from changes in proteolysis. J Physiol. 2008;586:4775–4781. - PMC - PubMed
    1. Alibegovic AC, Hojbjerre L, Sonne MP, van Hall G, Alsted TJ, Kiens B, Stallknecht B, Dela F, Vaag A. Increased rate of whole body lipolysis before and after 9 days of bed rest in healthy young men born with low birth weight. Am J Physiol Endocrinol Metab. 2010a;298:E555–564. - PubMed
    1. Alibegovic AC, Sonne MP, Hojbjerre L, Bork-Jensen J, Jacobsen S, Nilsson E, Faerch K, Hiscock N, Mortensen B, Friedrichsen M, Stallknecht B, Dela F, Vaag A. Insulin resistance induced by physical inactivity is associated with multiple transcriptional changes in skeletal muscle in young men. Am J Physiol Endocrinol Metab. 2010b;299:E752–763. - PubMed

Publication types

MeSH terms

Substances

LinkOut - more resources