

Evolution of heterogeneity (I2) estimates and their 95% confidence intervals in large meta-analyses
- PMID: 22848355
- PMCID: PMC3405079
- DOI: 10.1371/journal.pone.0039471
Evolution of heterogeneity (I2) estimates and their 95% confidence intervals in large meta-analyses
Abstract
Background: Assessment of heterogeneity is essential in systematic reviews and meta-analyses of clinical trials. The most commonly used heterogeneity measure, I(2), provides an estimate of the proportion of variability in a meta-analysis that is explained by differences between the included trials rather than by sampling error. Recent studies have raised concerns about the reliability of I(2) estimates, due to their dependence on the precision of included trials and time-dependent biases. Authors have also advocated use of 95% confidence intervals (CIs) to express the uncertainty associated with I(2) estimates. However, no previous studies have explored how many trials and events are required to ensure stable and reliable I(2) estimates, or how 95% CIs perform as evidence accumulates.
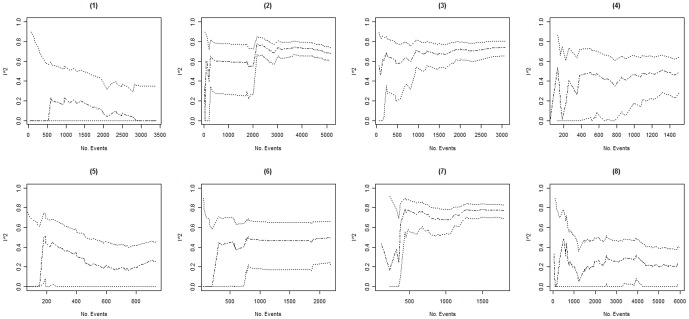
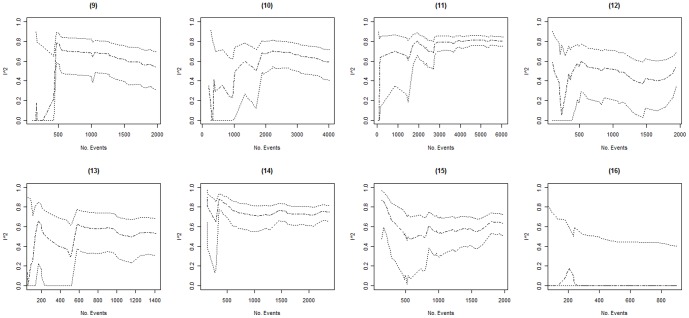
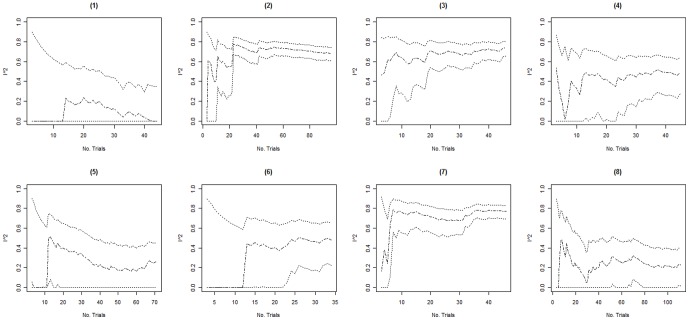
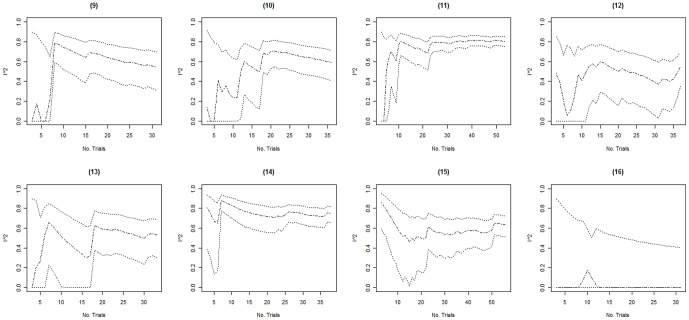
Methodology/principal findings: To assess the stability and reliability of I(2) estimates and their 95% CIs, in relation to the cumulative number of trials and events in meta-analysis, we looked at 16 large Cochrane meta-analyses--each including a sufficient number of trials and events to reliably estimate I(2)--and monitored the I(2) estimates and their 95% CIs for each year of publication. In 10 of the 16 meta-analyses, the I(2) estimates fluctuated more than 40% over time. The median number of events and trials required before the cumulative I(2) estimates stayed within +/-20% of the final I(2) estimate was 467 and 11. No major fluctuations were observed after 500 events and 14 trials. The 95% confidence intervals provided good coverage over time.
Conclusions/significance: I(2) estimates need to be interpreted with caution when the meta-analysis only includes a limited number of events or trials. Confidence intervals for I(2) estimates provide good coverage as evidence accumulates, and are thus valuable for reflecting the uncertainty associated with estimating I(2).
Conflict of interest statement
Figures
References
-
- Engels EA, Schmid CH, Terrin N, Olkin I, Lau J. Heterogeneity and statistical significance in meta-analysis: an empirical study of 125 meta-analyses. Statistics in Medicine. 2000;19:1707–1728. - PubMed
-
- Higgins JP, Thompson S. Quantifying heterogeneity in a meta-analysis. Statistics in Medicine. 2002;21:1539–1558. - PubMed
-
- Higgins JP, Green S. Cochrane Handbook for systematic reviews of interventions, version 5.0.0. John Wiley & Sons 2009
-
- Lau J, Ioaniddis JP, Schmid CH. Summing up evidence: one answer is not always enough. Lancet. 1998;351:123–127. - PubMed
MeSH terms
LinkOut - more resources
Full Text Sources
Medical
