. 2012;7(7):e40269.
doi: 10.1371/journal.pone.0040269. Epub 2012 Jul 25.

A new module in neural differentiation control: two microRNAs upregulated by retinoic acid, miR-9 and -103, target the differentiation inhibitor ID2

Affiliations

A new module in neural differentiation control: two microRNAs upregulated by retinoic acid, miR-9 and -103, target the differentiation inhibitor ID2

Daniela Annibali et al. PLoS One. 2012.

Abstract

The transcription factor ID2 is an important repressor of neural differentiation strongly implicated in nervous system cancers. MicroRNAs (miRNAs) are increasingly involved in differentiation control and cancer development. Here we show that two miRNAs upregulated on differentiation of neuroblastoma cells--miR-9 and miR-103--restrain ID2 expression by directly targeting the coding sequence and 3' untranslated region of the ID2 encoding messenger RNA, respectively. Notably, the two miRNAs show an inverse correlation with ID2 during neuroblastoma cell differentiation induced by retinoic acid. Overexpression of miR-9 and miR-103 in neuroblastoma cells reduces proliferation and promotes differentiation, as it was shown to occur upon ID2 inhibition. Conversely, an ID2 mutant that cannot be targeted by either miRNA prevents retinoic acid-induced differentiation more efficient than wild-type ID2. These findings reveal a new regulatory module involving two microRNAs upregulated during neural differentiation that directly target expression of the key differentiation inhibitor ID2, suggesting that its alteration may be involved in neural cancer development.


Conflict of interest statement

Competing Interests: The authors have declared that no competing interests exist.

Figures

Figure 1
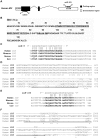
Figure 1. In silico analysis suggests that ID2 mRNA may be recognized by miR-9 and miR-103.
(A) Outline of the ID2 gene and putative miR-9 and miR-103 binding sites in the first coding exon and 3′UTR region, respectively. (B) ID2 amino acid sequence showing the region corresponding to the putative miR-9 target sequence in ID2 mRNA (bold, underlined) and the HLH domain (amino acids 36–76, highlighted). (C) Predicted duplex formation between human ID2 mRNA and miR-9, and sequences of the putative miR-9 binding site and surrounding regions within the ID2 coding regions of human, Rhesus monkey, mouse and rat. Nucleotide changes are underlined. (D) DNA sequence alignment of ID1-4 coding regions indicates that the putative miR-9 target site (underlined) is exclusively present within ID2. (E) Predicted duplex formation between ID2 3′UTR and miR-103, and sequence of the putative binding site within the 3′UTRs of human, Rhesus monkey, mouse and cow. Nucleotide changes are underlined. (F) Alignment of 3′UTR sequences of the four ID genes (ID1-4) shows that the putative miR-103 recognition site (underlined) is present exclusively in ID2. Shades in the alignments of panels C and E represent wobble base pairs. Asterisks in panels D and F mark conserved nucleotides.
Figure 2
Figure 2. ID2 mRNA is recognized by miR-9 and miR-103.
(A) Duplex formation between miR-9 and the ID2 coding region and sequence of mutated miR-9 recognition site present in Mut ID2. (B) Representative immunoblotting of ID2 in 293T cells transfected with vectors expressing the ID2 coding sequence - but not the 3′UTR - wild type or mutated in miR-9 recognition site (Mut ID2), together with vectors expressing miR-9, miR-103 or control vector (CTRL). Lane – represents untransfected cells. GAPDH was used as loading control. The histogram shows the relative quantities of ID2 and Mut ID2, as compared to cells transfected with control plasmids. (C) Luciferase reporter constructs harbouring the ID2 3′UTR or a mutant version carrying a deletion in the putative miR-103 target site (ΔmiR-103). (D) Luciferase activity (Firefly/Renilla ratio) of wild-type (white bars) and mutant (ΔmiR-103, black bars) ID2 3′UTR reporter gene in SK-N-BE (left) and SH-SY5Y (right) cells transfected with the miR-9 expressing vector, the miR-103 expressing vector or control (CTRL). Data are presented as mean values ± SD from at least three different experiments. ***: p-value<0.001.
Figure 3
Figure 3. ID2 expression is inversely correlated to miR-9 and miR-103.
Ectopic expression of miR-9 and miR-103 decreases ID2. (A) Immunoblotting of ID2 in SK-N-BE (upper panel) and SH-SY5Y (lower panel) cells treated with RA for 3, 6 and 10 days. The densitometric analysis on the right shows the relative amounts of ID2 versus untreated cells (0 time point), set to a level of 1. GAPDH was used as loading control. (B) Northern blotting of miR-9, miR-103 and miR-125b in SH-SY5Y cells treated with RA for the indicated times. The histogram shows the relative quantities of microRNAs versus the 0 time points set to a value of 1. 5S-rRNA was used as loading control. (C) Northern blotting of miR-9 and miR-103 in SK-N-BE ectopically expressing the single miRNAs. Cells transfected with an unrelated 21 nucleotide long RNA (CTRL) were used as control. (D) Representative immunoblotting of ID2 in SK-N-BE (top) and SH-SY5Y (bottom) cells ectopically expressing miR-9, miR-103, the two together, or the control vector (CTRL). GAPDH was used as loading control. Data in the histogram show the relative quantities of ID2 versus control cells. Data are presented as mean values ± SD from at least three different experiments. *: p-value<0.05; **: p-value<0.01; ***: p-value<0.001).
Figure 4
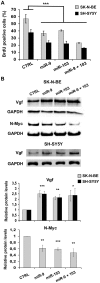
Figure 4. miR-9 and miR-103 restrain proliferation and affect differentiation marker expression.
(A) BrdU incorporation assay in SK-N-BE (grey bars) and SH-SY5Y (black bars) cells transfected with plasmids expressing miR-9, miR-103, a combination of the two, or control (CTRL). Values represent means ± SD of three independent transfections. (B) Immunoblotting of Vgf and N-Myc in SK-N-BE (upper panel) and SH-SY5Y (lower panel) cells transfected with vectors expressing miR-9, miR-103, the two together or control (CTRL). GAPDH was used as loading control. The histograms display the relative quantities (means ± SD) of Vgf and N-Myc versus control cells, from at least three different experiments. *: p-value<0.05; **: p-value<0.01, ***: p-value<0.001.
Figure 5
Figure 5. miR-9 and miR-103 trigger neuronal differentiation.
(A) Northern blotting in SH-EP cells infected with lentiviruses expressing miR-9, miR-103 or empty lentivirus as control. (B) Representative immunoblotting of ID2 in SH-EP cells infected with lentiviruses expressing miR-9, miR-103, a combination of the two, or with empty lentivirus as control (CTRL). GAPDH was used as loading control. The histogram displays the relative amounts of ID2 – compared to control cells (mean values ± SD from three independent experiments. *: p-value<0.05; **: p-value<0.01). (C) Phase contrast images of SH-EP cells infected with lentiviruses expressing miR-9, miR-103, the two together, or control virus (CTRL). We evaluated the percentage of differentiated cells by counting the number of cells with neurites versus the total number of cells in three microscope fields. Percentages were al follows. CTRL: 0%; miR-9: 84.8±3.2; miR-103: 85.9±2.3; miR-9+103: 80,4±2,7. (D) Immunofluorescence staining of the neurofilament heavy polypeptide NF200 (red) in SH-EP cells infected as in panel C. Nuclei were stained with DAPI (4,6-diamidino-2-phenylindole, blue).
Figure 6
Figure 6. The non-targetable version of ID2 mRNA rescues proliferation rate and N-Myc expression in differentiating SK-N-BE cells.
(A) Rescue of N-Myc expression. Left panel: representative immunoblotting of N-Myc and ID2 in differentiating SK-N-BE cells (lanes RA) transfected with 1 or 2 µg of vector expressing full-length ID2 cDNA, including 3′UTR (lanes pID2); 1 or 2 µg of the non-targetable version of ID2 cDNA, mutated in both miR-9 and miR-103 recognition sites (lanes DM ID2); the empty vector (CTRL). The symbol – denotes untransfected cells. ß-actin was used as a loading control. Middle panel: histogram displaying the relative N-Myc protein levels – compared to control cells and normalised against actin protein levels (mean values ± SD, from three independent experiments. ***: p-value<0.001). Right panel: the histogram shows the relative ID2 mRNA levels in differentiating SK-N-BE cells transfected with 1 or 2 µg of the above described ID2 constructs – compared to control cells. Values, expressed as means ± SD from three independent experiments, are normalised against GAPDH mRNA. (B) Proliferation rate rescue. Left panel: immunofluorescence staining of BrdU incorporation (purple) in SK-N-BE cells transfected with 2 µg of wild-type ID2 cDNA (pID2 +RA), 2 µg of the non-targetable version of ID2 cDNA (DM ID2 +RA), or with the empty vector (CTRL +RA). Untreated SK-N-BE cells were also assayed (−RA). Nuclei were stained with DAPI (4,6-diamidino-2-phenylindole, blue). Right panel: quantification of BrdU positive cells. White bar: untreated SK-N-BE cells; black bars: RA-treated SK-N-BE cells, transfected as above. Values, expressed as a percentage of the total cell number, represent means ± SD from three independent experiments. **: p-value<0.01.

References

    1. Ruzinova MB, Benezra R. Id proteins in development, cell cycle and cancer. Trends Cell Biol. 2003;13:410–418. - PubMed
    1. Ohtani N, Zebedee Z, Huot TJ, Stinson JA, Sugimoto M, et al. Opposing effects of Ets and Id proteins on p16INK4a expression during cellular senescence. Nature. 2001;409:1067–1070. - PubMed
    1. Roberts EC, Deed RW, Inoue T, Norton JD, Sharrocks AD. Id helix-loop-helix proteins antagonize pax transcription factor activity by inhibiting DNA binding. Mol Cell Biol. 2001;21:524–533. - PMC - PubMed
    1. Chassot AA, Turchi L, Virolle T, Fitsialos G, Batoz M, et al. Id3 is a novel regulator of p27kip1 mRNA in early G1 phase and is required for cell-cycle progression. Oncogene. 2007;26:5772–5783. - PubMed
    1. Iavarone A, Garg P, Lasorella A, Hsu J, Israel MA. The helix-loop-helix protein Id-2 enhances cell proliferation and binds to the retinoblastoma protein. Genes Dev. 1994;8:1270–1284. - PubMed

Publication types

MeSH terms