Clinical Trial
. 2012;7(7):e41361.
doi: 10.1371/journal.pone.0041361. Epub 2012 Jul 25.

Differential DNA methylation in purified human blood cells: implications for cell lineage and studies on disease susceptibility

Affiliations
Clinical Trial

Differential DNA methylation in purified human blood cells: implications for cell lineage and studies on disease susceptibility

Lovisa E Reinius et al. PLoS One. 2012.

Abstract

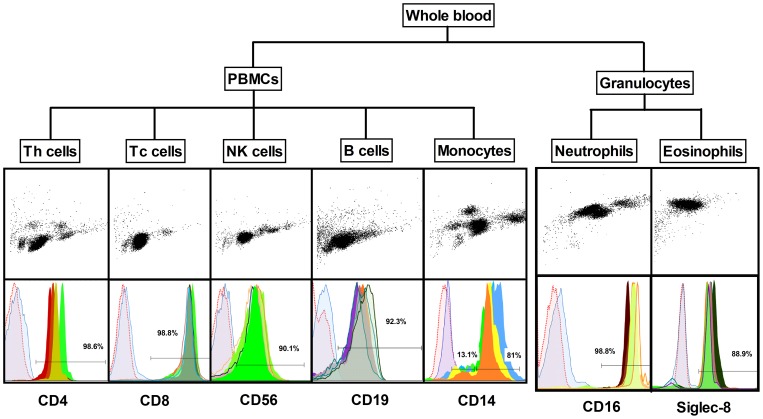
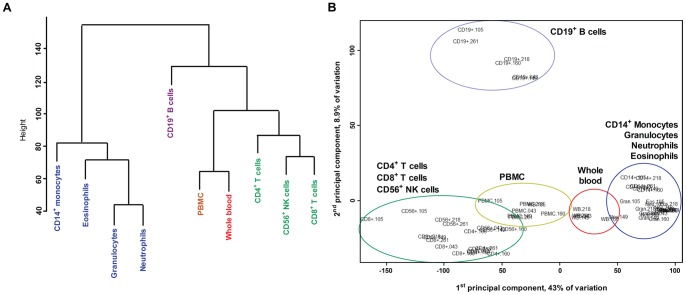
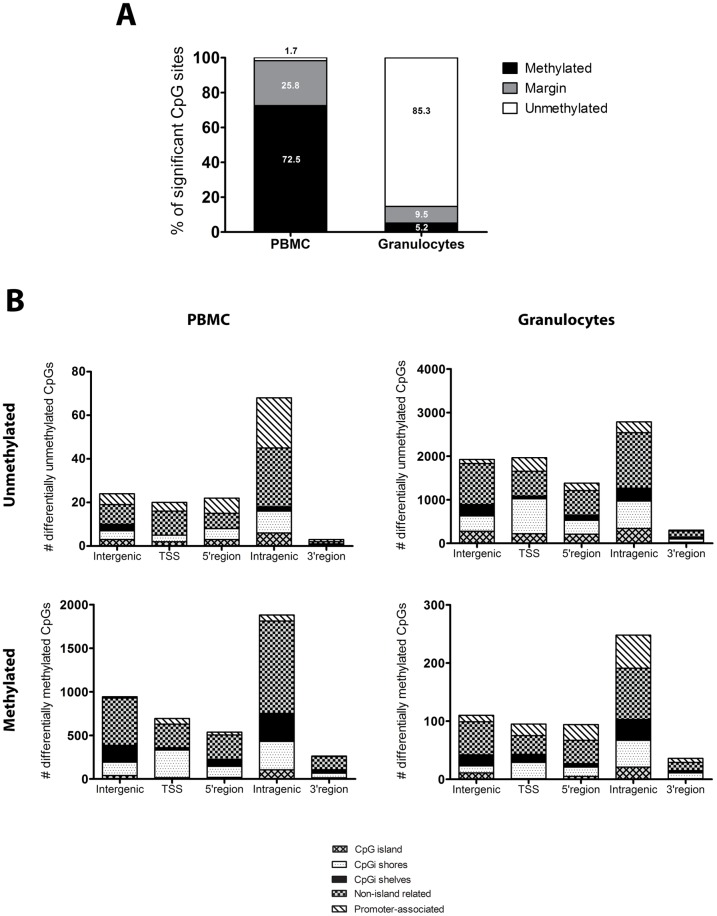
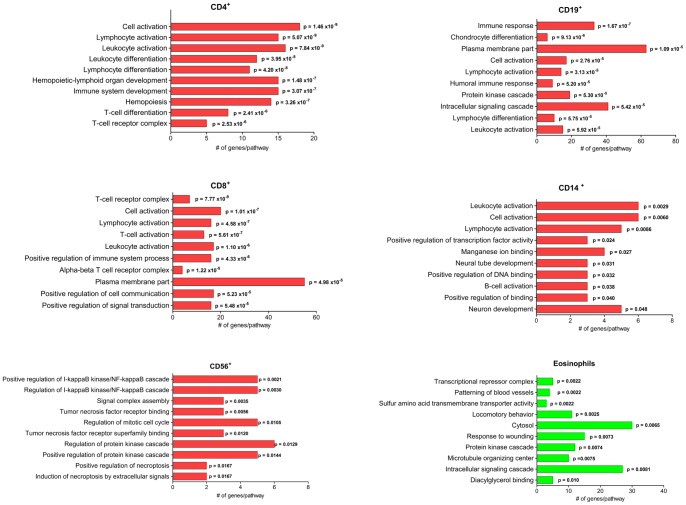
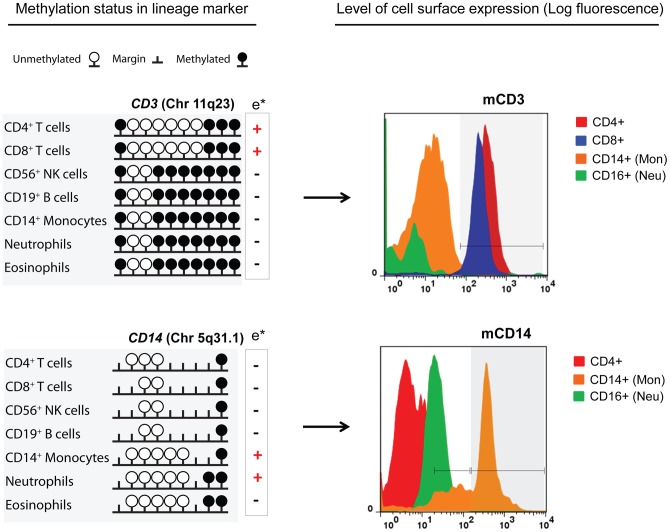
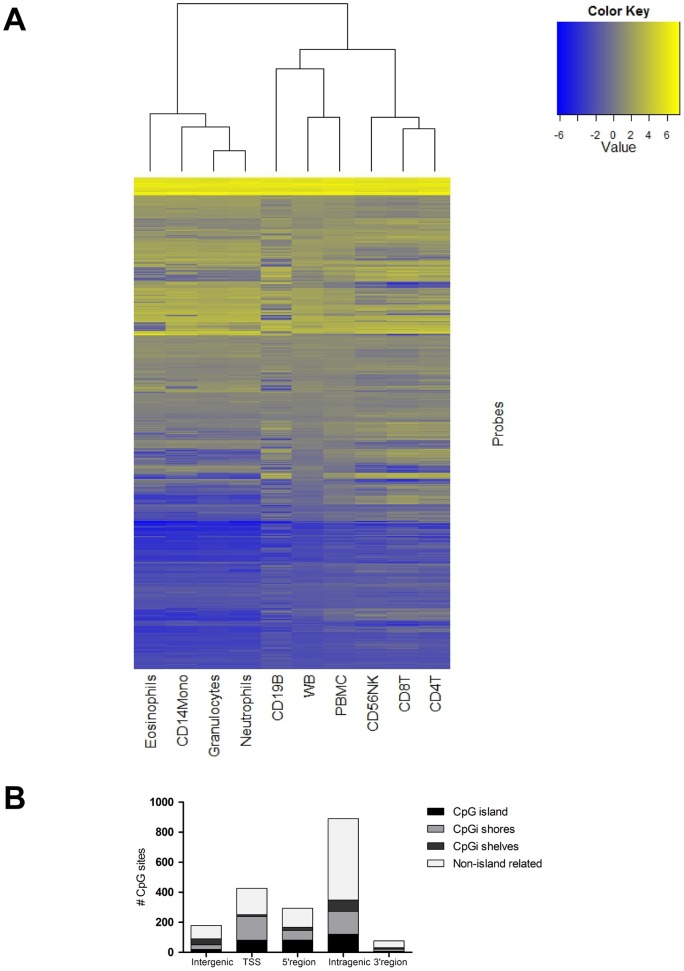
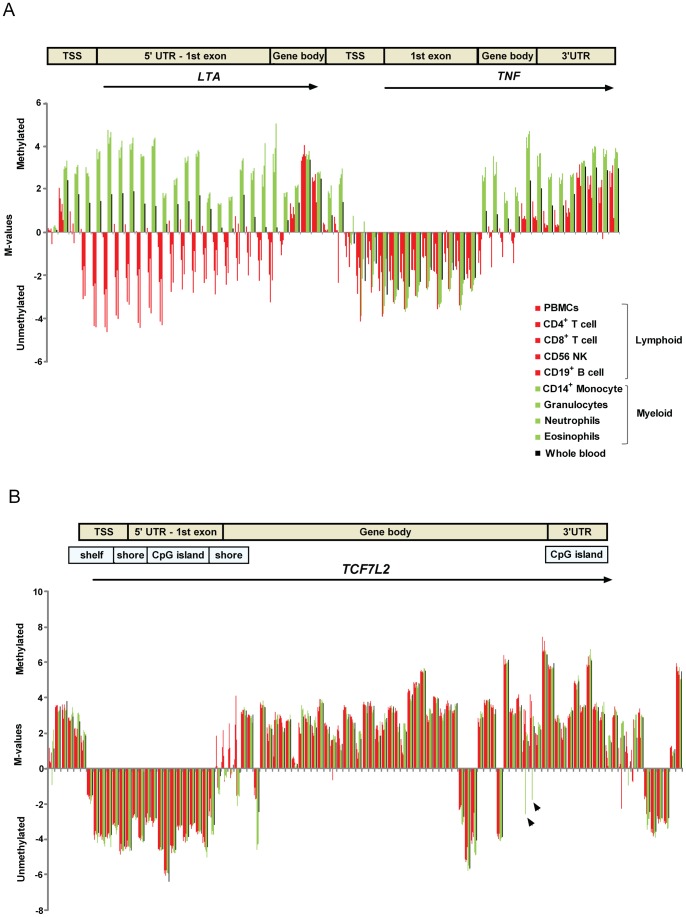
Methylation of cytosines at CpG sites is a common epigenetic DNA modification that can be measured by a large number of methods, now even in a genome-wide manner for hundreds of thousands of sites. The application of DNA methylation analysis is becoming widely popular in complex disorders, for example, to understand part of the "missing heritability". The DNA samples most readily available for methylation studies are derived from whole blood. However, blood consists of many functionally and developmentally distinct cell populations in varying proportions. We studied whether such variation might affect the interpretation of methylation studies based on whole blood DNA. We found in healthy male blood donors there is important variation in the methylation profiles of whole blood, mononuclear cells, granulocytes, and cells from seven selected purified lineages. CpG methylation between mononuclear cells and granulocytes differed for 22% of the 8252 probes covering the selected 343 genes implicated in immune-related disorders by genome-wide association studies, and at least one probe was differentially methylated for 85% of the genes, indicating that whole blood methylation results might be unintelligible. For individual genes, even if the overall methylation patterns might appear similar, a few CpG sites in the regulatory regions may have opposite methylation patterns (i.e., hypo/hyper) in the main blood cell types. We conclude that interpretation of whole blood methylation profiles should be performed with great caution and for any differences implicated in a disorder, the differences resulting from varying proportions of white blood cell types should be considered.


Conflict of interest statement

Competing Interests: The authors have declared that no competing interests exist.

Figures

Figure 1
Figure 1. Schematic presentation of the isolation protocol and purity of the cell populations as measured by flow cytometry.
Peripheral blood mononuclear cells (PBMC) and granulocytes were obtained by density gradient centrifugation and seven cell populations were purified by magnetic sorting. Upper panel shows forward and side scatter which confirmed cell morphology and granularity. The lower panel shows the overlay of cell surface markers for all the six donors. The purities of the cell populations were highly similar among all the six donors. Th cells  =  CD4+ T cells, Tc cells  =  CD8+ T cells, NK cells  =  CD56+ NK cells, B cells  =  CD19+ B cells, Monocytes  =  CD14+ monocytes. Data analyses are based on the comparison of all cell populations to whole blood.
Figure 2
Figure 2. Clustering of cell populations in blood with regard to global DNA methylation.
A) Hierarchical tree presenting the relationship between cell populations based on median M-values from six donors. B) Principal component analysis of each individual sample showing specific clustering based on cell population.
Figure 3
Figure 3. Differentially methylated CpG sites compared between peripheral blood mononuclear cells (PBMC) and granulocytes.
A) The distribution of probes in the two populations defined by the calls unmethylated, margin and methylated. Data is based on a linear model comparing the two principal cell populations to whole blood using M-values. The data was then subjected to a gamma fit model in order to group the data into the defined calls. The value within the bars represents the percentage of the distribution within each population. B) The genomic distribution of probes showing significantly differential methylation compared to whole blood for PBMC and granulocytes. Genomic regions were defined according to the UCSC RefGene group (included in the Illumina annotation data). Probes are divided on the unmethylated and methylated state according to the gamma fit model for both PBMC and granulocytes. Intergenic  =  site not annotated in a gene, TSS  =  transcription start site at 200–1500 bp, 5′ region  = 5′UTR and 1st exon, Intragenic  =  gene body including introns and exons and, 3′ region  = 3′UTR. UTR – untranslated region.
Figure 4
Figure 4. Gene ontology enrichment for isolated cell populations.
Gene ontology was performed using DAVID (http://david.abcc.ncifcrf.gov) . The human genome was used as background and the level of significance was set to p<0.05. The top ten enriched pathways are described for genes showing significantly differentially methylated probes in comparison to whole blood where the cell population shows unmethylated state and whole blood shows methylated state according to the gamma fit model. Red color indicates peripheral blood mononuclear cells (PBMC) and green color indicates granulocytes.
Figure 5
Figure 5. Differentially methylated sites are harbored by cell-specific genes but the connection between methylation status and surface expression depend on the gene and lineage.
The surface expression of CD3 and CD14 according to the methylation status of the coding gene is presented. Demethylation of CpG sites was observed in T cells expressing the CD3 marker (upper panel). For CD14 the difference between positive and negative cells involved cell-restricted marginal status in a context of demethylation (lower panel). Histograms (right) represent the log fluorescence of the marker (x-axis) and the cell counts (y-axis). Peaks within the gray shaded gates represent positive populations. For CD14 two gates are presented, the “low” which include monocytes and a fraction of neutrophils and the “high” population of monocytes. m  =  membrane; e*  =  positive or negative cell expression of the marker according to the Human Leucocyte Differentiation Antigens (HLDA) Workshop and CD nomenclature (http://www.hcdm.org/Home/tabid/36/Default.aspx).
Figure 6
Figure 6. Differentially methylated CpG sites in candidate genes related to inflammatory diseases.
A) Heatmap of 1865 probes representing 293 candidate genes for selected inflammatory diseases showing differential methylation in blood cell populations. Candidate genes for the diseases asthma, atopy, atopic dermatitis, inflammatory bowel disease, rheumatoid arthritis, systemic lupus erythematosus, Type 1 and Type 2 diabetes were selected from the Genome wide association study atlas (http://www.genome.gov/gwastudies/) . The heatmap is based on median M-values. The M-value is calculated as the log2 ratio of the intensities of methylated probe versus unmethylated probe . Blue color indicates low DNA methylation while yellow represents high DNA methylation. WB  =  whole blood, CD4T  =  CD4+ T cells, CD8T  =  CD8+ T cells, CD56NK  =  CD56+ NK cells, CD19B  =  CD19+ B cells, CD14Mono  =  CD14+ monocytes. B) The genomic distribution of the differentially methylated probes associated with inflammatory complex diseases according to the UCSC RefGene group (included in the Illumina annotation data). Intergenic  =  site not annotated in a gene, TSS  =  transcription start site at 200–1500 bp, 5′ region  = 5′UTR and 1st exon, Intragenic  =  gene body including introns and exons and, 3′ region  = 3′UTR. UTR – untranslated region.
Figure 7
Figure 7. DNA methylation levels across the gene regions in purified cell populations for candidate genes.
DNA methylation is defined by the M-values for each cell population at a given CpG site. The M-value is calculated as the log2 ratio of the intensities of methylated probe versus unmethylated probe and describes a measurement of how much more a probe is methylated compared to unmethylated . Negative numbers represent unmethylated and positive numbers represent methylated. Every cell population correspond to a vertical bar which is listed from left to right as peripheral blood mononuclear cells (PBMC), CD4+ T cells, CD8+ T cells, CD56+ NK cells, CD19+ B cells, CD14+ monocytes, granulocytes, neutrophils, eosinophils and whole blood. Lymphoid cells are colored in red bars, myeloid cells are colored in green bars and whole blood is represented by black bars. A) the asthma candidate genes lymphotoxin alpha (LTA) and tumor necrosis factor (TNF), and B) the Type 2 diabetes candidate gene transcription factor 7-like 2 (TCF7L2), black arrows indicate regions with cell type specific pattern for monocytes. TSS  =  transcription start site at 200–1500 bp; UTR  =  untranslated region, gene body including introns and exons.

References

    1. Deaton AM, Bird A. CpG islands and the regulation of transcription. Genes Dev. 2011;25:1010–1022. - PMC - PubMed
    1. Bocker MT, Hellwig I, Breiling A, Eckstein V, Ho AD, et al. Genome-wide promoter DNA methylation dynamics of human hematopoietic progenitor cells during differentiation and aging. Blood. 2011;117:e182–189. - PubMed
    1. Liang P, Song F, Ghosh S, Morien E, Qin M, et al. Genome-wide survey reveals dynamic widespread tissue-specific changes in DNA methylation during development. BMC Genomics. 2011;12:231. - PMC - PubMed
    1. Cedar H, Bergman Y. Epigenetics of haematopoietic cell development. Nat Rev Immunol. 2011;11:478–488. - PubMed
    1. Isagawa T, Nagae G, Shiraki N, Fujita T, Sato N, et al. DNA methylation profiling of embryonic stem cell differentiation into the three germ layers. PLoS One. 2011;6:e26052. - PMC - PubMed

Publication types