. 2012;7(7):e41423.
doi: 10.1371/journal.pone.0041423. Epub 2012 Jul 27.

Genome-wide histone acetylation is altered in a transgenic mouse model of Huntington's disease

Affiliations

Genome-wide histone acetylation is altered in a transgenic mouse model of Huntington's disease

Karen N McFarland et al. PLoS One. 2012.

Abstract

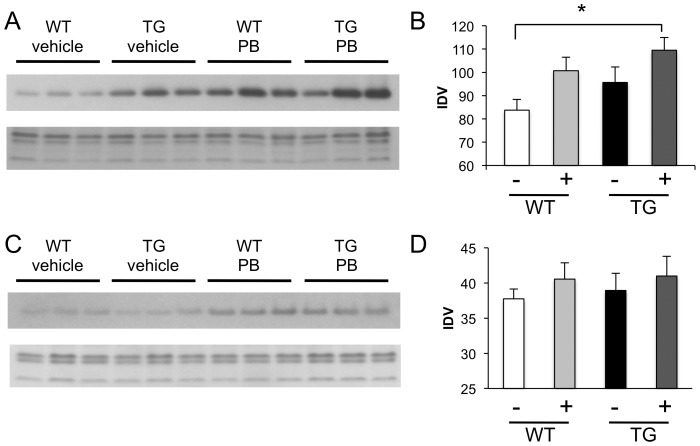
In Huntington's disease (HD; MIM ID #143100), a fatal neurodegenerative disorder, transcriptional dysregulation is a key pathogenic feature. Histone modifications are altered in multiple cellular and animal models of HD suggesting a potential mechanism for the observed changes in transcriptional levels. In particular, previous work has suggested an important link between decreased histone acetylation, particularly acetylated histone H3 (AcH3; H3K9K14ac), and downregulated gene expression. However, the question remains whether changes in histone modifications correlate with transcriptional abnormalities across the entire transcriptome. Using chromatin immunoprecipitation paired with microarray hybridization (ChIP-chip), we interrogated AcH3-gene interactions genome-wide in striata of 12-week old wild-type (WT) and transgenic (TG) R6/2 mice, an HD mouse model, and correlated these interactions with gene expression levels. At the level of the individual gene, we found decreases in the number of sites occupied by AcH3 in the TG striatum. In addition, the total number of genes bound by AcH3 was decreased. Surprisingly, the loss of AcH3 binding sites occurred within the coding regions of the genes rather than at the promoter region. We also found that the presence of AcH3 at any location within a gene strongly correlated with the presence of its transcript in both WT and TG striatum. In the TG striatum, treatment with histone deacetylase (HDAC) inhibitors increased global AcH3 levels with concomitant increases in transcript levels; however, AcH3 binding at select gene loci increased only slightly. This study demonstrates that histone H3 acetylation at lysine residues 9 and 14 and active gene expression are intimately tied in the rodent brain, and that this fundamental relationship remains unchanged in an HD mouse model despite genome-wide decreases in histone H3 acetylation.


Conflict of interest statement

Competing Interests: The authors have declared that no competing interests exist.

Figures

Figure 1
Figure 1. AcH3 interactions at gene loci are decreased in TG striata.
(A) The number of AcH3-bound probes in WT (white bars) and TG (black bars) striata. (B) Percent of total genes bound by AcH3 in WT and TG striata.
Figure 2
Figure 2. AcH3 binding patterns within a gene and across chromosomes are diminished in TG striata.
(A) Distribution of the number of AcH3 binding events in WT and TG striata expressed as probes bound per gene. (B) Distribution of AcH3-gene associations for each chromosome in WT and TG striata expressed as a percentage of AcH3-bound genes per total genes on each chromosome. White bars, WT; black bars, TG.
Figure 3
Figure 3. AcH3-gene associations are distributed across the genome and correlate with expressed genes.
Localization of AcH3-gene interactions (green) along each chromosome and are co-localized with steady-state gene expression (blue) in WT (left) and TG striata (right). Horizontal black line, length of chromosome; Vertical black lines, locations of genes. Inset, a closer view of Chromosome 1 from 90574275 bp–93452450 bp.
Figure 4
Figure 4. AcH3 localization is found downstream of transcriptional start sites within the gene.
(A) Schematic indicating the location of probes as defined by Agilent annotation. Promoter = upstream of transcriptional start site; Inside = within coding region of gene; Downstream = downstream of coding region; Divergent promoter = located within the upstream region of two genes transcribed in opposite directions; Unknown = unannotated. (B) Locations of probes within the gene expressed as percent bound of total probe type within the microarray. (C) Numbers of genes bound as expressed by AcH3-bound locationsWhite bars, WT; black bars, TG.
Figure 5
Figure 5. Differential histone H3 acetylation within WT and TG striata.
Hypoacetyled in Tg (light grey), gene is bound by AcH3 in both WT and TG but binding is decreased in TG; Not acetylated in TG (black), AcH3 is associated with the gene only in the WT state; Hyperacetylated in TG (medium grey), gene is bound by AcH3 in both WT and TG but binding is increased in TG; Ectopically acetylated in TG (dark grey), AcH3 is associated with the gene only in the TG state; Not acetylated, gene does not have AcH3 associated in either WT or TG states.
Figure 6
Figure 6. Single gene ChIP confirmation of differentially acetylated genes.
(A) Genes with decreased acetylation as predicted by their composite score. (B) Genes with increased acetylation as predicted by their composite score. The order of the genes from left-right indicates their relative ranking by composite score. *, p-value<0.05; **, p-value<0.01. White bars, WT; black bars, TG; grey bars, mock condition. Error bars are standard deviation.
Figure 7
Figure 7. AcH3-localization within the gene changes upon gene expression.
AcH3-localization within the gene changes on transcriptional status of the gene. White bars, WT; black bars, TG.
Figure 8
Figure 8. Gene expression changes are not strongly associated with changes in histone H3 acetylation in the R6/2 TG striatum.
(A) Classification of differentially acetylated histone H3 genes whose expression are decreased in the TG striatum. (B) Classification of differentially acetylated histone H3 genes whose expression are increased in the TG striatum.
Figure 9
Figure 9. Phenylbutyrate treatment increases global histone H3 acetylation in R6/2 liver and cerebellum.
(A) Western blot demonstrating AcH3 levels in histone extracts from WT and TG R6/2 livers (top), Coomassie blue gel staining demonstrates equal loading (bottom). (B) Integrated densitometry values (IDV) for AcH3 levels in A. (C) Western blot demonstrating AcH3 levels in histone extracts from WT and TG R6/2 cerebellum (top). Coomassie blue gel staining demonstrates equal loading (bottom). (D) Integrated densitometry values (IDV) for AcH3 levels in C. White bars, WT, vehicle (veh) treated (n = 9); Light grey bars, WT, phenylbutyrate (PB) treated (n = 8); Black bars, Tg, vehicle (veh) treated (n = 7); Dark grey bars, Tg, phenylbutyrate (PB) treated (n = 11). *, p-value<0.05. Error bars are standard deviation.
Figure 10
Figure 10. Phenylbutyrate treatment increases transcript levels of downregulated gene in TG striata but does not increase acetylation levels at gene loci.
(A) Transcript levels of downregulated genes in the Tg striata. (B) Single-gene ChIP for the enrichment of AcH3 at gene regions. White bars, WT, vehicle treated; Light grey bars, WT, phenylbutyrate treated; Black bars, Tg, vehicle treated; Dark grey bars, Tg, phenylbutyrate treated. *, p<0.05; **, p<0.01. Error bars are standard deviation.

References

    1. Huntington's Disease Collaborative Research Group (1993) A novel gene containing a trinucleotide repeat that is expanded and unstable on Huntington's disease chromosomes. Cell 72: 971–983. - PubMed
    1. Bates G, Harper PS, Jones L (2002) Huntington's Disease.
    1. Cha JH (2007) Transcriptional signatures in Huntington's disease. Prog Neurobiol 83: 228–248. - PMC - PubMed
    1. Stack EC, Del Signore SJ, Luthi-Carter R, Soh BY, Goldstein DR, et al. (2007) Modulation of nucleosome dynamics in Huntington's disease. Hum Mol Genet 16: 1164–1175. - PubMed
    1. Ryu H, Lee J, Hagerty SW, Soh BY, McAlpin SE, et al. (2006) ESET/SETDB1 gene expression and histone H3 (K9) trimethylation in Huntington's disease. Proc Natl Acad Sci U S A 103: 19176–19181. - PMC - PubMed

Publication types