Clinical Trial
. 2012;7(7):e41456.
doi: 10.1371/journal.pone.0041456. Epub 2012 Jul 25.

Plasma lysophosphatidylcholine levels are reduced in obesity and type 2 diabetes

Affiliations
Clinical Trial

Plasma lysophosphatidylcholine levels are reduced in obesity and type 2 diabetes

Melissa N Barber et al. PLoS One. 2012.

Abstract

Background: Obesity and type 2 diabetes (T2DM) are associated with increased circulating free fatty acids and triacylglycerols. However, very little is known about specific molecular lipid species associated with these diseases. In order to gain further insight into this, we performed plasma lipidomic analysis in a rodent model of obesity and insulin resistance as well as in lean, obese and obese individuals with T2DM.

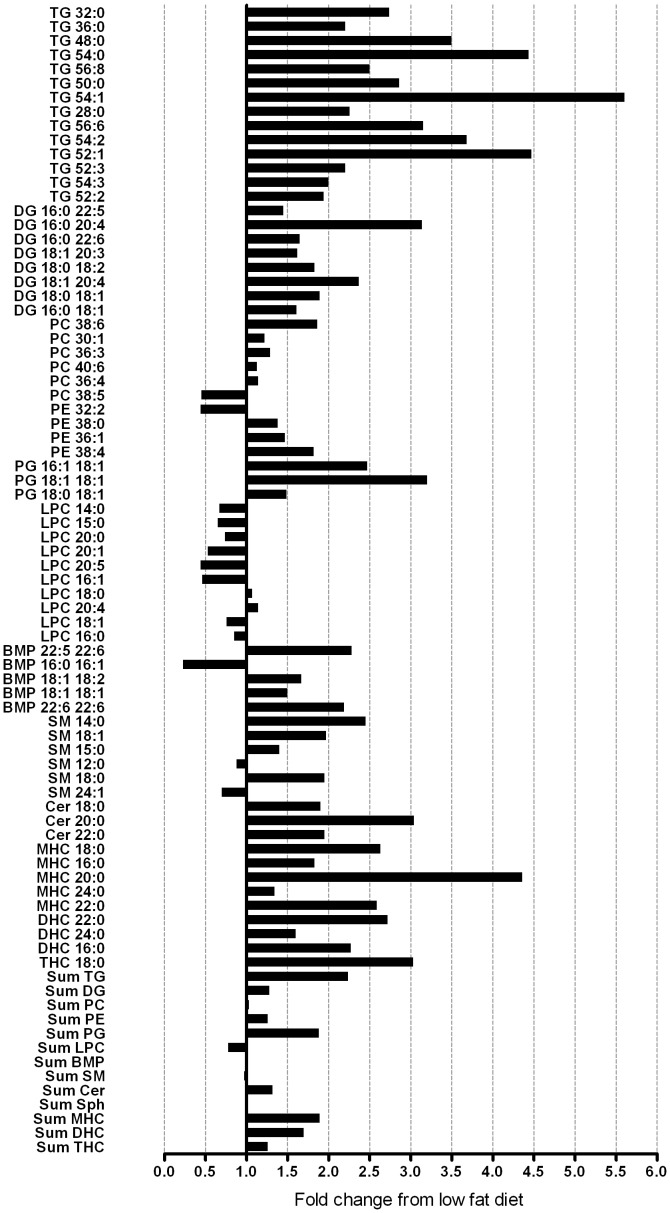
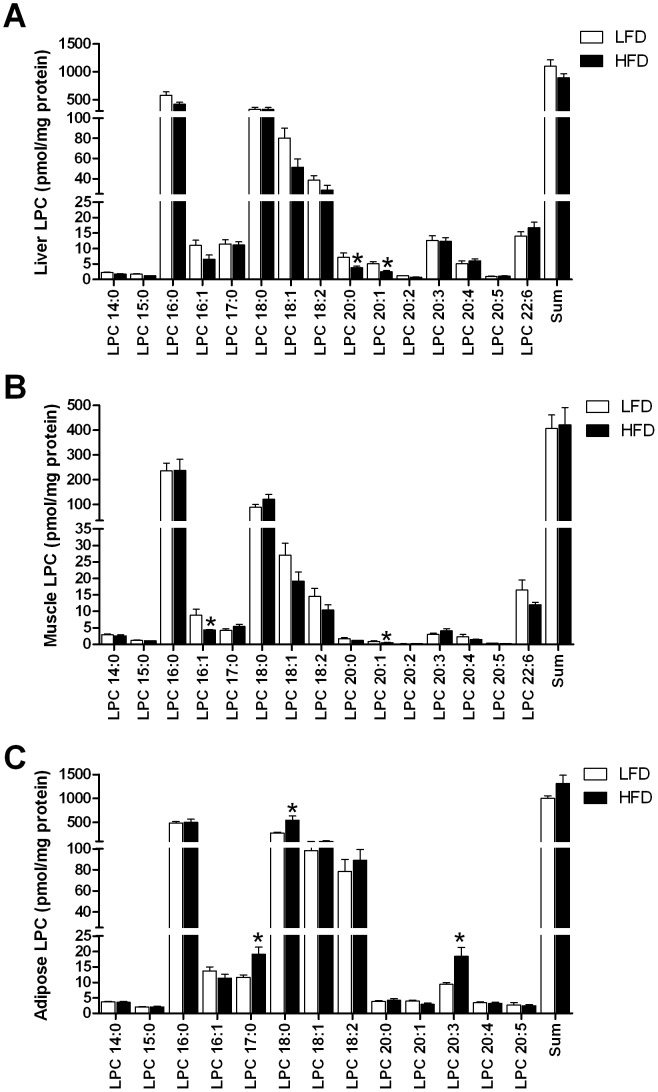
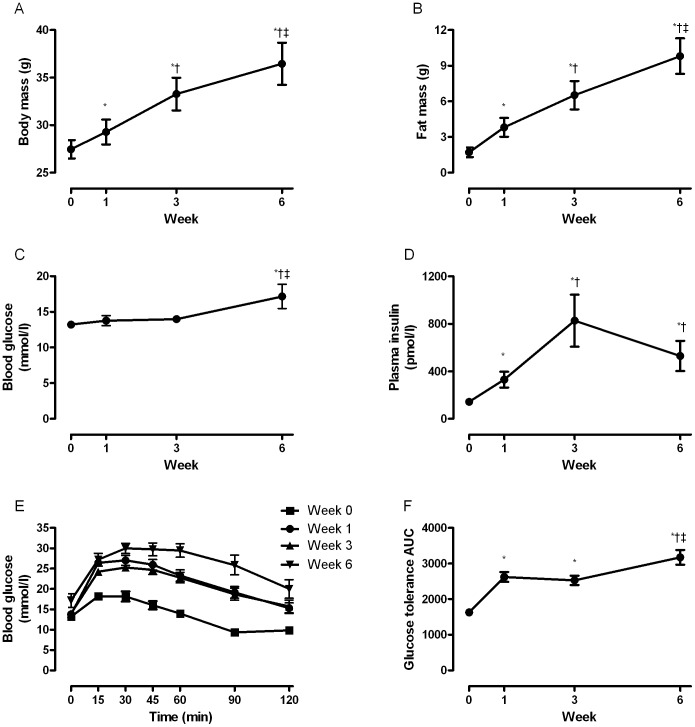
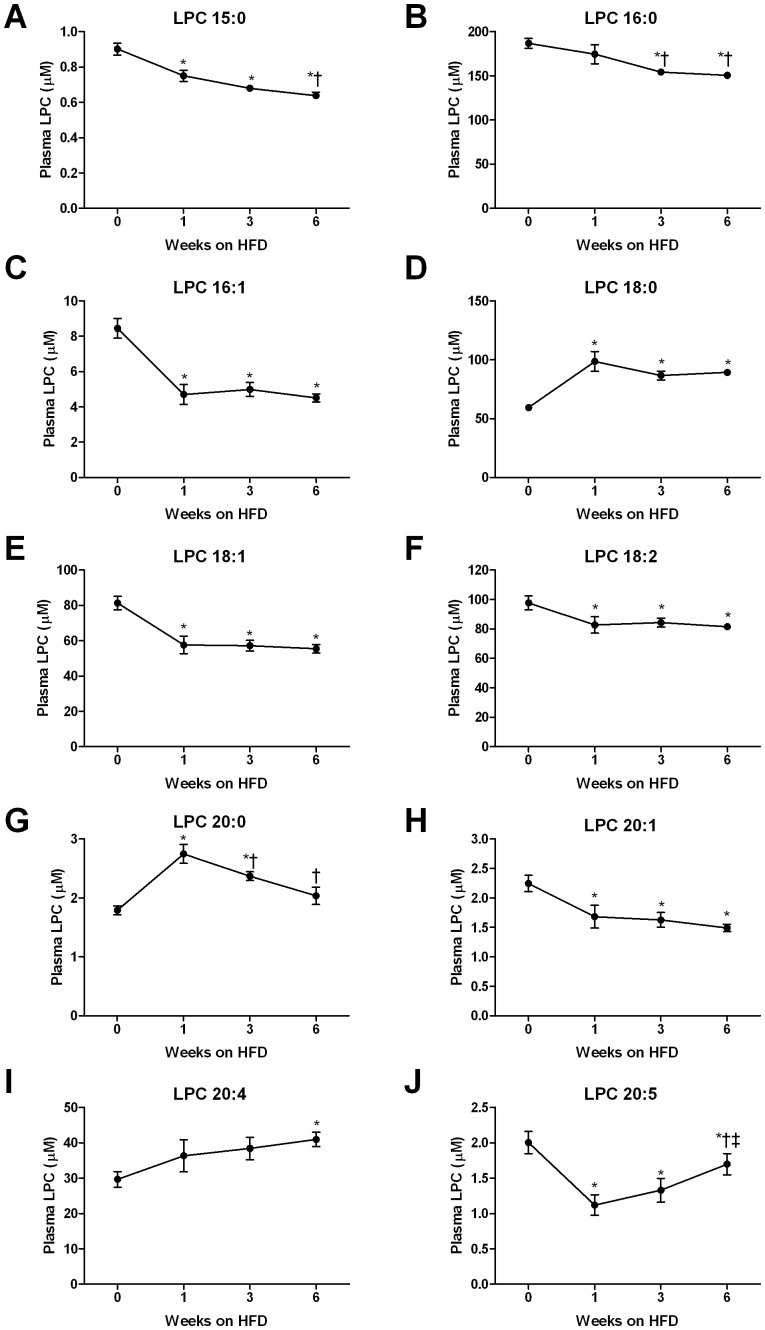
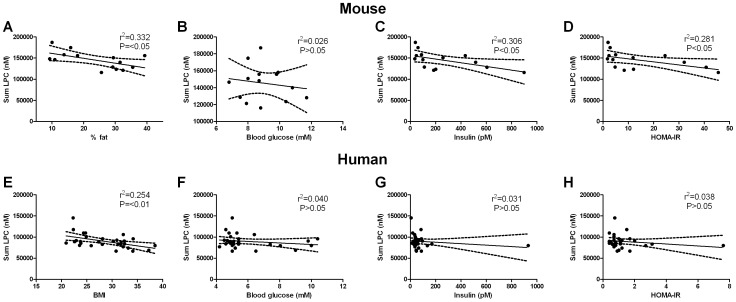
Methodology/principal findings: Lipidomic analysis using liquid chromatography coupled to mass spectrometry revealed marked changes in the plasma of 12 week high fat fed mice. Although a number of triacylglycerol and diacylglycerol species were elevated along with of a number of sphingolipids, a particularly interesting finding was the high fat diet (HFD)-induced reduction in lysophosphatidylcholine (LPC) levels. As liver, skeletal muscle and adipose tissue play an important role in metabolism, we next determined whether the HFD altered LPCs in these tissues. In contrast to our findings in plasma, only very modest changes in tissue LPCs were noted. To determine when the change in plasma LPCs occurred in response to the HFD, mice were studied after 1, 3 and 6 weeks of HFD. The HFD caused rapid alterations in plasma LPCs with most changes occurring within the first week. Consistent with our rodent model, data from our small human cohort showed a reduction in a number of LPC species in obese and obese individuals with T2DM. Interestingly, no differences were found between the obese otherwise healthy individuals and the obese T2DM patients.

Conclusion: Irrespective of species, our lipidomic profiling revealed a generalized decrease in circulating LPC species in states of obesity. Moreover, our data indicate that diet and adiposity, rather than insulin resistance or diabetes per se, play an important role in altering the plasma LPC profile.


Conflict of interest statement

Competing Interests: The authors have declared that no competing interests exist.

Figures

Figure 1
Figure 1. The effect of high-fat diet on the plasma lipidome.
Significant mean fold changes (P<0.05) observed in plasma lipids from mice fed a high fat diet for 12 week (N = 6) relative to low fat fed animals (N = 8). Plasma lipids were analysed by LC ESI-MS/MS and absolute lipid levels were expressed relative to the low fat fed control group. Plasma samples were obtained from 5 hour fasted animals. BMP, bismonoacylglycerolphosphate; Cer, ceramide; DG, diacylglycerol; DHC, dihexosylceramide; LPC, lysophosphatidylcholine; MHC, monohexosylceramide; PC, phosphatidylcholine; PE, phosphatidylethanolamine; PG, phosphatidylglycerol; SM, sphingomyelin; Sph, sphingosine; TG, triacylglycerol; THC, trihexosylceramide.
Figure 2
Figure 2. Tissue lysophosphatidylcholine levels in low and high fat fed mice.
Liver (A), skeletal muscle (B) and adipose tissue (C) lysophosphatidylcholine (LPC) levels measured by LC ESI-MS/MS in mice fed a low (N = 8) or high fat diet (HFD, N = 6). Tissues were collected from 5 hour fasted animals. Data are presented as mean ± SEM. *P<0.05 versus low fat.
Figure 3
Figure 3. Time course changes in metabolic parameters measured in mice fed a high fat diet.
Body mass (A), fat mass (B), fasting blood glucose (C), plasma insulin (D), blood glucose during an intraperitoneal glucose tolerance test (E) and blood glucose area under the curve during an intraperitoneal glucose tolerance test (F) were measured in mice (N = 11) following a 5 hour fast at baseline (time 0) and after 1, 3 and 6 weeks of high fat feeding. Data are presented as mean ± SEM. *P<0.05 versus baseline; P<0.05 versus week 1; P<0.05 versus week 3.
Figure 4
Figure 4. Time course changes in selected lysophosphatidylcholine (LPC) species measured in plasma of mice fed a high fat diet.
LPC 15∶0 (A), LPC 16∶0 (B), LPC 16∶1 (C), LPC 18∶0 (D), LPC 18∶1 (E), LPC 18∶2 (F), LPC 20∶0 (G), LPC 20∶1 (H), LPC 20∶4 (I) and LPC 20∶5 (J) were measured in mice (N = 11) following a 5 hour fast at baseline (time 0) and after 1, 3 and 6 weeks of high fat feeding using LC ESI-MS/MS. Data are presented as mean ± SEM. *P<0.05 versus baseline; P<0.05 versus week 1; P<0.05 versus week 3.
Figure 5
Figure 5. Relationship between plasma lysophosphatidylcholine (LPC), adiposity and indices of insulin resistance in high fat fed mice (A–D) and lean, obese and obese type 2 diabetic humans (E–H).
The association between circulating LPC and percent body fat (A), blood glucose (B), plasma insulin (C) and HOMA-IR (D) in high fat fed mice. The association between circulating LPC and BMI (E), blood glucose (F), plasma insulin (G) and HOMA-IR (H) in the human cohort. Data are presented as line of best fit with 95% confidence intervals.

References

    1. Boden G, Shulman GI. Free fatty acids in obesity and type 2 diabetes: defining their role in the development of insulin resistance and beta-cell dysfunction. Eur J Clin Invest. 2002;32:14–23. - PubMed
    1. Bernstein RM, Davis BM, Olefsky JM, Reaven GM. Hepatic insulin responsiveness in patients with endogenous hypertriglyceridaemia. Diabetologia. 1978;14:249–253. - PubMed
    1. Reaven GM, Hollenbeck C, Jeng CY, Wu MS, Chen YD. Measurement of plasma glucose, free fatty acid, lactate, and insulin for 24 h in patients with NIDDM. Diabetes. 1988;37:1020–1024. - PubMed
    1. Graessler J, Schwudke D, Schwarz PE, Herzog R, Shevchenko A, et al. Top-down lipidomics reveals ether lipid deficiency in blood plasma of hypertensive patients. PLoS One. 2009;15:e6261. - PMC - PubMed
    1. Schwab U, Seppänen-Laakso T, Yetukuri L, Agren J, Kolehmainen M, et al. Triacylglycerol fatty acid composition in diet-induced weight loss in subjects with abnormal glucose metabolism - the GENOBIN study. PLoS One. 2008;3:e2630. - PMC - PubMed

Publication types