. 2012;7(7):e41793.
doi: 10.1371/journal.pone.0041793. Epub 2012 Jul 27.

Subthalamic nucleus electrical stimulation modulates calcium activity of nigral astrocytes

Affiliations

Subthalamic nucleus electrical stimulation modulates calcium activity of nigral astrocytes

Elodie Barat et al. PLoS One. 2012.

Abstract

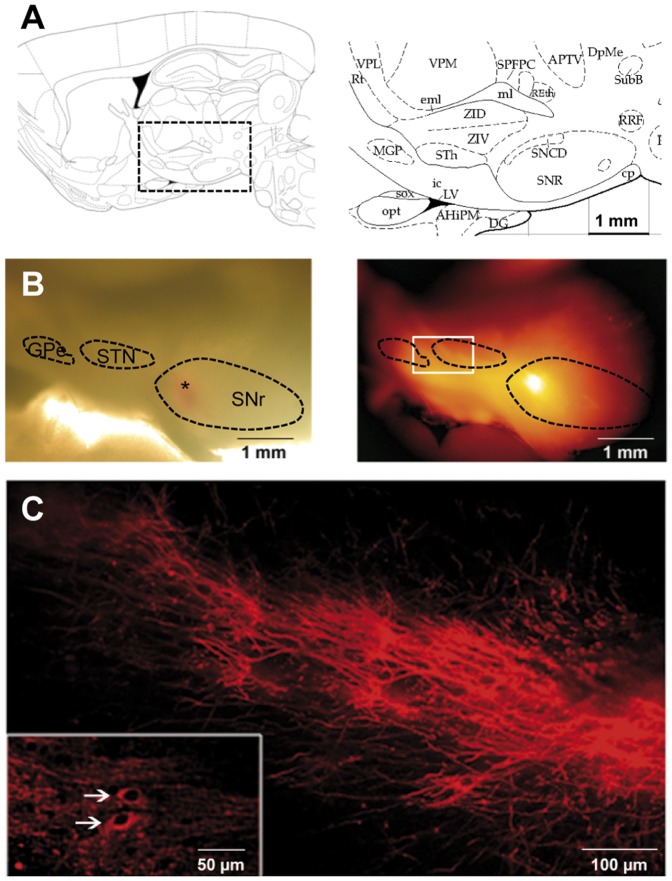
Background: The substantia nigra pars reticulata (SNr) is a major output nucleus of the basal ganglia, delivering inhibitory efferents to the relay nuclei of the thalamus. Pathological hyperactivity of SNr neurons is known to be responsible for some motor disorders e.g. in Parkinson's disease. One way to restore this pathological activity is to electrically stimulate one of the SNr input, the excitatory subthalamic nucleus (STN), which has emerged as an effective treatment for parkinsonian patients. The neuronal network and signal processing of the basal ganglia are well known but, paradoxically, the role of astrocytes in the regulation of SNr activity has never been studied.

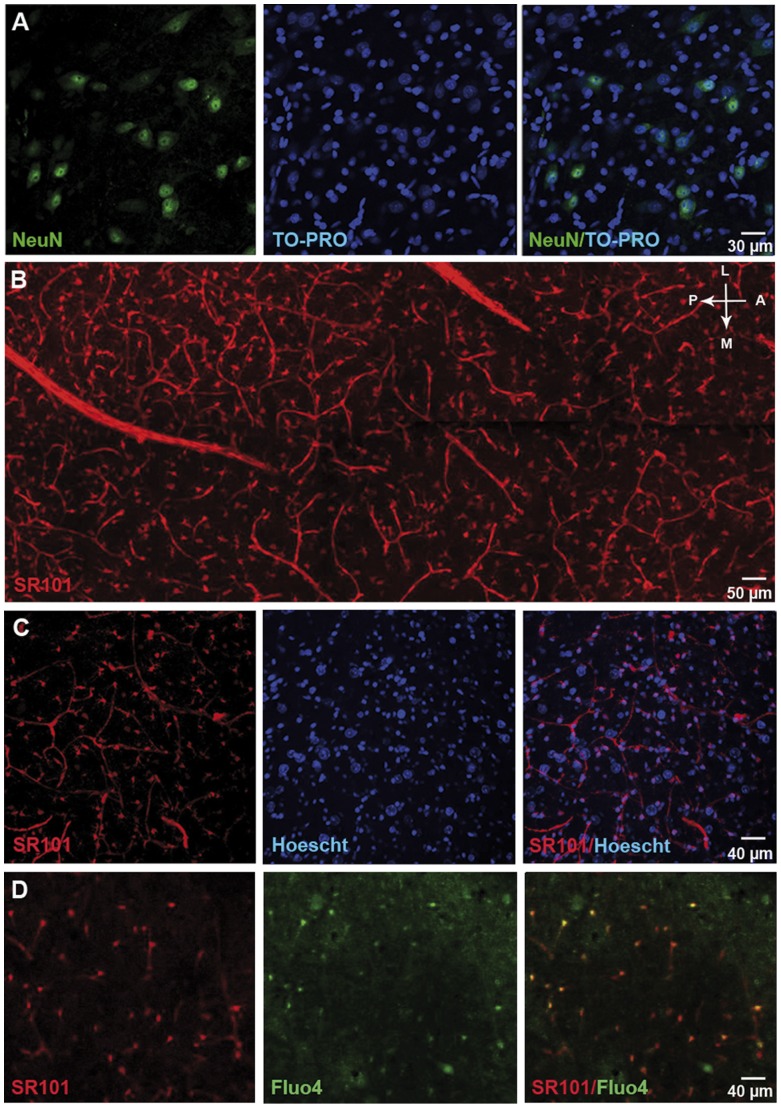
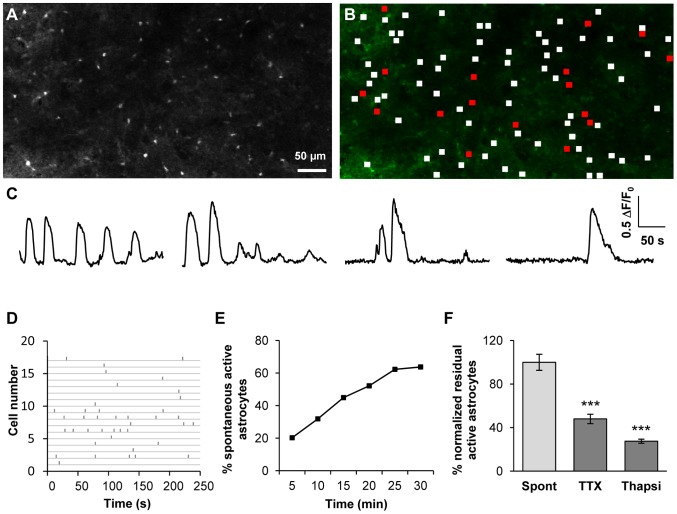
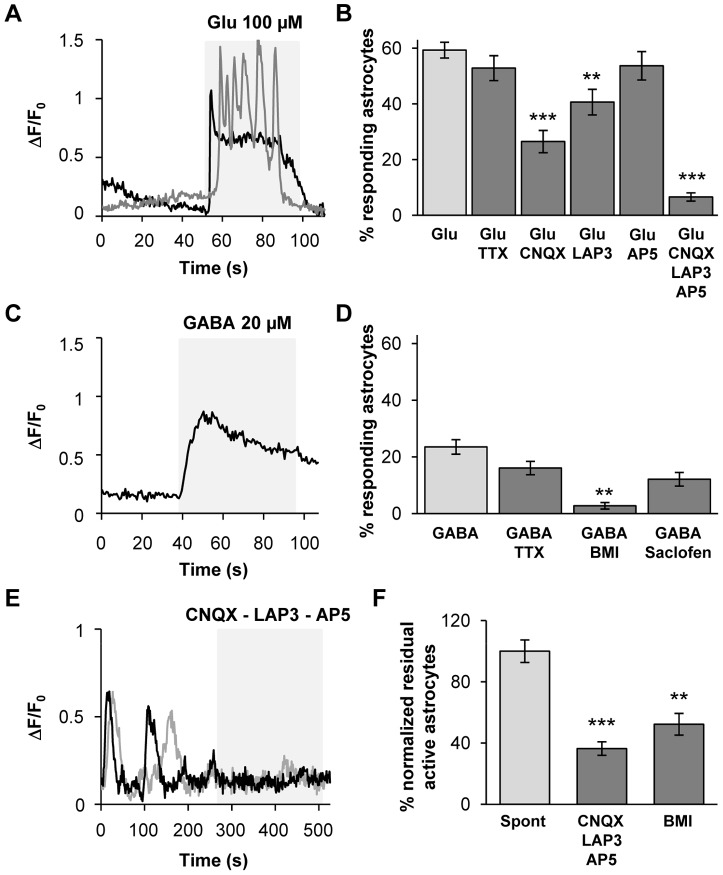
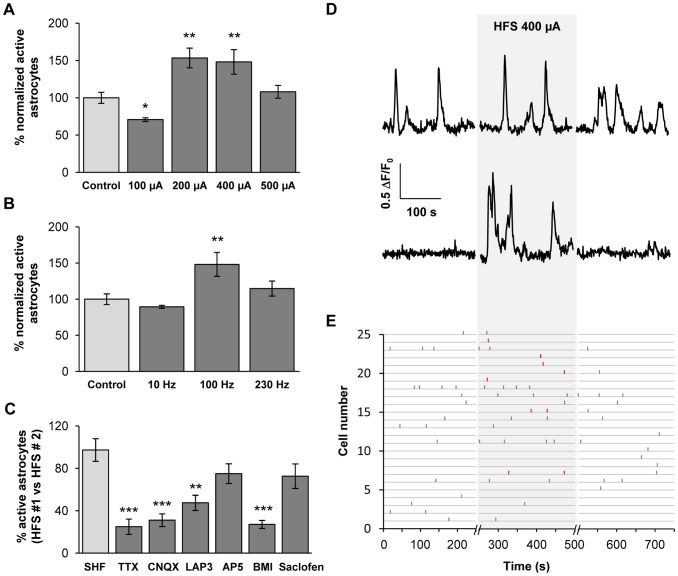
Principal findings: In this work, we developed a rat brain slice model to study the influence of spontaneous and induced excitability of afferent nuclei on SNr astrocytes calcium activity. Astrocytes represent the main cellular population in the SNr and display spontaneous calcium activities in basal conditions. Half of this activity is autonomous (i.e. independent of synaptic activity) while the other half is dependent on spontaneous glutamate and GABA release, probably controlled by the pace-maker activity of the pallido-nigral and subthalamo-nigral loops. Modification of the activity of the loops by STN electrical stimulation disrupted this astrocytic calcium excitability through an increase of glutamate and GABA releases. Astrocytic AMPA, mGlu and GABA(A) receptors were involved in this effect.

Significance: Astrocytes are now viewed as active components of neural networks but their role depends on the brain structure concerned. In the SNr, evoked activity prevails and autonomous calcium activity is lower than in the cortex or hippocampus. Our data therefore reflect a specific role of SNr astrocytes in sensing the STN-GPe-SNr loops activity and suggest that SNr astrocytes could potentially feedback on SNr neuronal activity. These findings have major implications given the position of SNr in the basal ganglia network.


Conflict of interest statement

Competing Interests: The authors have declared that no competing interests exist.

Figures

Figure 1
Figure 1. Subthalamo-nigral and pallido-nigral anatomic connections are preserved in sagittal slices.
(A) Schematic diagram of the area of interest (right panel) in a sagittal brain slice (left panel, modified from [33]) showing the location of the STN (indicated as STh), GPe (MGP) and SNr (SNR). (B) A DiI crystal was placed in the SNr (depicted by the asterisk in the bright field image, left part) and the slice was incubated for 4 weeks at room temperature. DiI diffused towards STN and GPe (epifluorescence image on the right). (C) Higher magnification of the region indicated by the white rectangle on image B showing subthalamo-nigral and pallido-nigral projections. In some cases, DiI tracing showed retrograde labeling of some cells in the STN (inset, white arrows).
Figure 2
Figure 2. Characterization of SNr cell populations and Fluo-4 loaded cells.
(A) NeuN staining (green) labels few cells within SNr. Nuclei are identified by TO-PRO staining (blue). Merged image showing the proportion of neurons within the SNr (right panel). (B) Two-photon multistack (40 slices at 2 µm spacing) mosaic reconstruction of SNr astrocytes and vessels in an acute brain slice 2 h after sulforhodamine 101 (10 mg/ml) intravenous injection (100 µl/50 g body weight). Antero-posterior (AP) and medio-lateral (ML) orientations are shown in the upper right part of the figure. (C) Bi-photon imaging of sulforhodamine 101 (red) and Hoescht 33342 (blue) in the SNr. Merged image showing the proportion of astrocytes within the SNr (right panel). (D) Representative confocal images of SR101-labeled (red) and Fluo-4-loaded (green) cells in the SNr of a sagittal acute slice of rat brain. Merged image showing sulforhodamine 101 and Fluo-4 staining within the SNr, confirming that most of the loaded cells are astrocytes.
Figure 3
Figure 3. SNr astrocytes display spontaneous calcium activity that is partly dependent on neuronal activity.
(A) Fluo-4 loaded cells in the SNr area of a rat sagittal acute slice. Only small cells (astrocytes, less than 10 µm in diameter) were loaded. GABAergic and dopaminergic neurons (with cell bodies from 20 to 40 µm in diameter [70]) were not labelled in most cases. (B) Distribution of active (red frames) and non active (white frames) ROIs within the slice shown in A. (C) Example of typical fluorescence variations recorded in four SNr astrocytes. (D) Raster plot of fluorescence peaks detected in active ROIs described in B. (E) Example of the cumulative progress of the proportion of active astrocytes during recording over 5, 10, 15, 20, 25 and 30 minutes. (F) Effect of 500 nM TTX (n = 13 slices; p<0.001) or 2 µM thapsigargin (Thapsi, n = 7 slices; p<0.001) on the spontaneous calcium activity of astrocytes in the SNr.
Figure 4
Figure 4. SNr astrocytes AMPA, mGlu and GABAA receptors are involved in calcium spontaneous activity.
(A) Example of two typical fluorescence variation profiles recorded in SNr astrocytes when 100 µM glutamate was perfused in the bath. (B) Histogram of the percentage of loaded SNr astrocytes responding to the application of 100 µM glutamate (n = 15) and the effect of 500 nM TTX (n = 12; p = 0.317), 10 µM CNQX (n = 8; p<0.001), 100 µM LAP-3 (n = 11; p = 0.005), 50 µM AP-5 (n = 4; p = 0.453) or a cocktail containing 10 µM CNQX+100 µM LAP-3+50 µM AP-5 (n = 4; p = 0.001) on this glutamate-induced effect. (C) Typical fluorescence variations recorded in a SNr astrocyte when 20 µM GABA was perfused in the bath. (D) Histogram of the percentage of loaded SNr astrocytes responding to the application of 20 µM GABA (n = 18) and the effect of 500 nM TTX (n = 7; p = 0.215), 20 µM BMI (n = 7; p = 0.02) or 100 µM saclofen (n = 8; p = 0.948) on this GABA-induced effect. (E) Typical fluorescence variations recorded in two SNr astrocytes before and after incubation with a cocktail containing 10 µM CNQX+100 µM LAP-3+50 µM AP-5. (F) Histogram showing the effect of a cocktail containing 10 µM CNQX+100 µM LAP-3+50 µM AP-5 (n = 10; p<0.001) or 20 µM BMI (n = 7; p = 0.003) on the spontaneous calcium activity of astrocytes in the SNr. The inhibitory effect is normalized with respect to control residual activity. *, p<0.05; **, p<0.01 and ***, p<0.001.
Figure 5
Figure 5. SNr astrocytic calcium activity is modulated by STN electrical stimulation.
(A) Proportion of loaded astrocytes in the SNr displaying calcium activity during five minutes of STN-HFS (100 Hz) at an intensity of 100 µA (n = 14; p = 0.011), 200 µA (n = 15; p = 0.008), 400 µA (n = 14; p = 0.004) or 500 µA (n = 8; p = 0.375). (B) Proportion of loaded astrocytes in the SNr displaying calcium activity during 5 minutes of STN electrical stimulation at 400 µA with a frequency of 10 Hz (n = 15; p = 0.896), 100 Hz (n = 14; p = 0.004) or 230 Hz (n = 5; p = 0.817). The effect of STN electrical stimulation was normalized with respect to control residual activity. (C) Percentage of SNr astrocytes responding to STN electrical stimulation (100 Hz, 200 µA) in the presence of ACSF (SHF; n = 9), 500 nM TTX (n = 9; p = 0.001), 10 µM CNQX (n = 9; p<0.001), 100 µM LAP-3 (n = 8; p = 0.01), 50 µM AP-5 (n = 13; p = 0.121), 20 µM bicuculline (BMI; n = 30; p<0.001) or 100 µM saclofen (n = 7; p = 0.266). Inhibitory effects were compared to a first recording under STN-HFS in the same area. *, p<0.05; **, p<0.01 and ***, p<0.001. (D) Typical fluorescence variations recorded in two SNr astrocytes before, during (gray background) and after STN-HFS (100 Hz, 400 µA) (E) Raster plot of fluorescence peaks detected in active ROIs before, during (gray background) and after STN-HFS (100 Hz, 400 µA), exemplifying that only the number of active cells is enhanced while the frequency in active cells is not affected. Newly active cells during STN-HFS are depicted in red.

References

    1. Hikosaka O. GABAergic output of the basal ganglia. Prog Brain Res. 2007;160:209–226. - PubMed
    1. Richards CD, Shiroyama T, Kitai ST. Electrophysiological and immunocytochemical characterization of GABA and dopamine neurons in the substantia nigra of the rat. Neuroscience. 1997;80:545–557. - PubMed
    1. DeLong MR. Primate models of movement disorders of basal ganglia origin. Trends Neurosci. 1990;13:281–285. - PubMed
    1. Plenz D, Kital ST. A basal ganglia pacemaker formed by the subthalamic nucleus and external globus pallidus. Nature. 1999;400:677–682. - PubMed
    1. Kitai ST, Deniau JM. Cortical inputs to the subthalamus: intracellular analysis. Brain Res. 1981;214:411–415. - PubMed

Publication types

MeSH terms

Substances